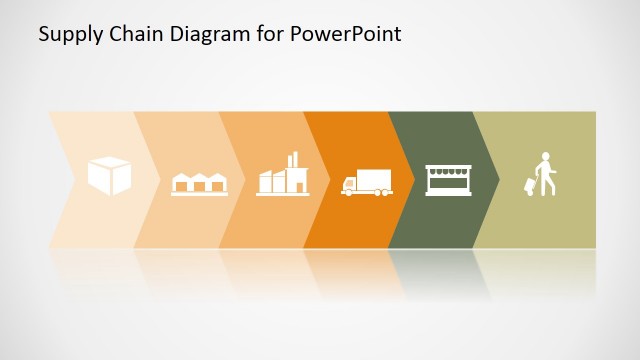
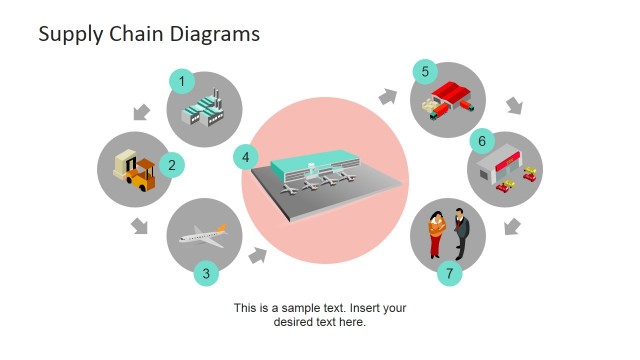
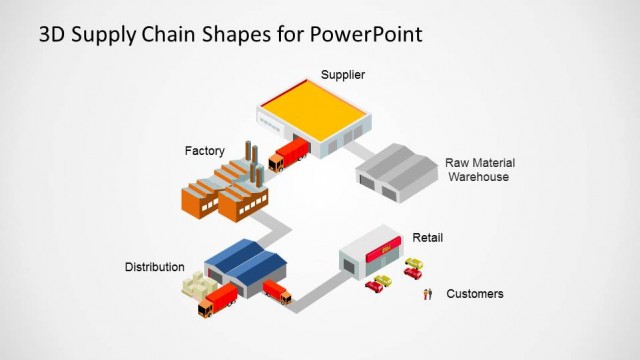
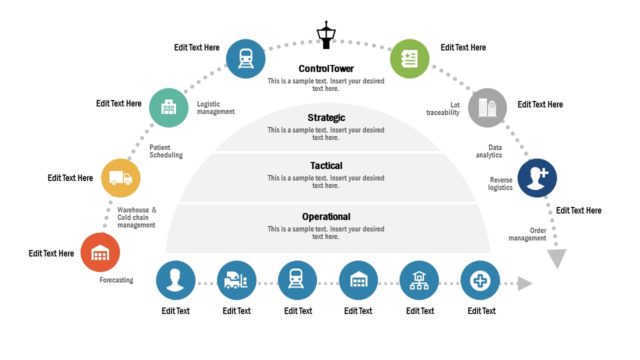
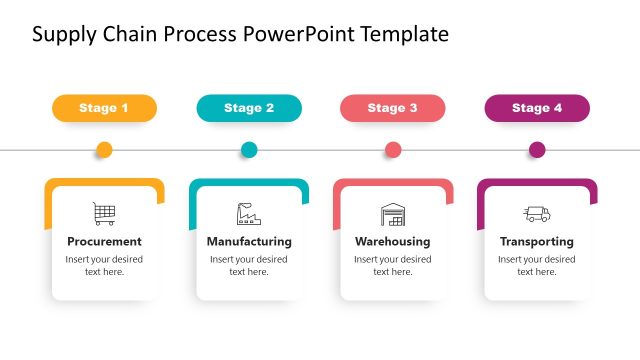
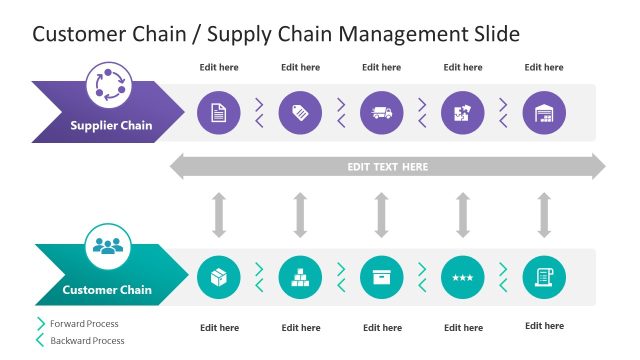
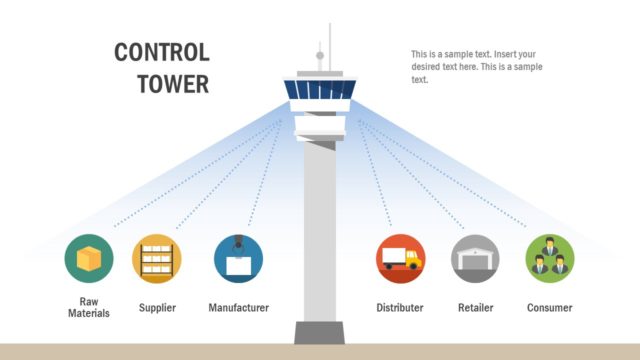
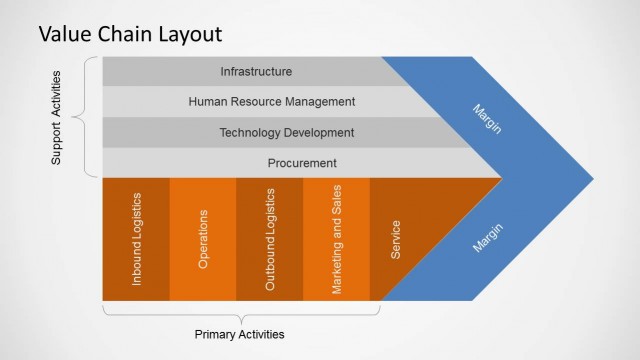
The Flat Supply Chain Diagram is a professionally designed PowerPoint template which can be used by presenters to introduce lecture and seminar attendees to the rudiments, intricacies and methods of analysis within conventional supply chains. The supply chain finance PPT can be part of lectures or to prepare complete slide decks on Supply Chain management topics.
A supply chain denotes the complex system of collaboration between organizations, people, activities, information and resources which are together necessary to ensure the continued production of goods or services from supplier to customer. Commonly these chains describe the activities which precipitate the transformation of natural resources, raw materials and other necessary components into a finished product that is ultimately delivered to the end user. Typical supply chains begin with the actual extraction of resources; generally starting with an initial harvesting and regulation of ecological and biological resources. They will often demonstrate the various production links (for instance: component construction, assembly and merging) before indicating the numerous off-shore storage facilities through which products pass through before eventually reaching the consumers.
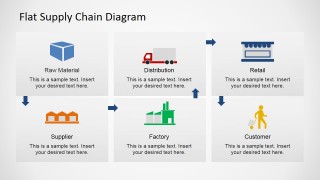
The Flat Supply Chain Diagram is ideally used by practitioners within supply chain management. Supply chain management draws heavily from constituent areas of operations management, logistics, procurement and information technology. The diagram strives to illustrate the integrated and cross-functional approach to business management that supply chains can be remarked upon for. It includes high quality clip art icons that depict the management and movement of raw materials between organizations, factory works, suppliers, distributors and retail outlets before ultimately reaching the targeted consumers.
The Flat Supply Chain Diagram is a fully editable template that uses customizable vector graphic icons that are compatible with all PowerPoint applications to create composite images to serve as visual aids in presentations of supply chain management. Everything that you see on display in the template – whether background, clip art, color or text – can be optimized for any environment or audience.
What’s inside this template
Example presentation scenarios
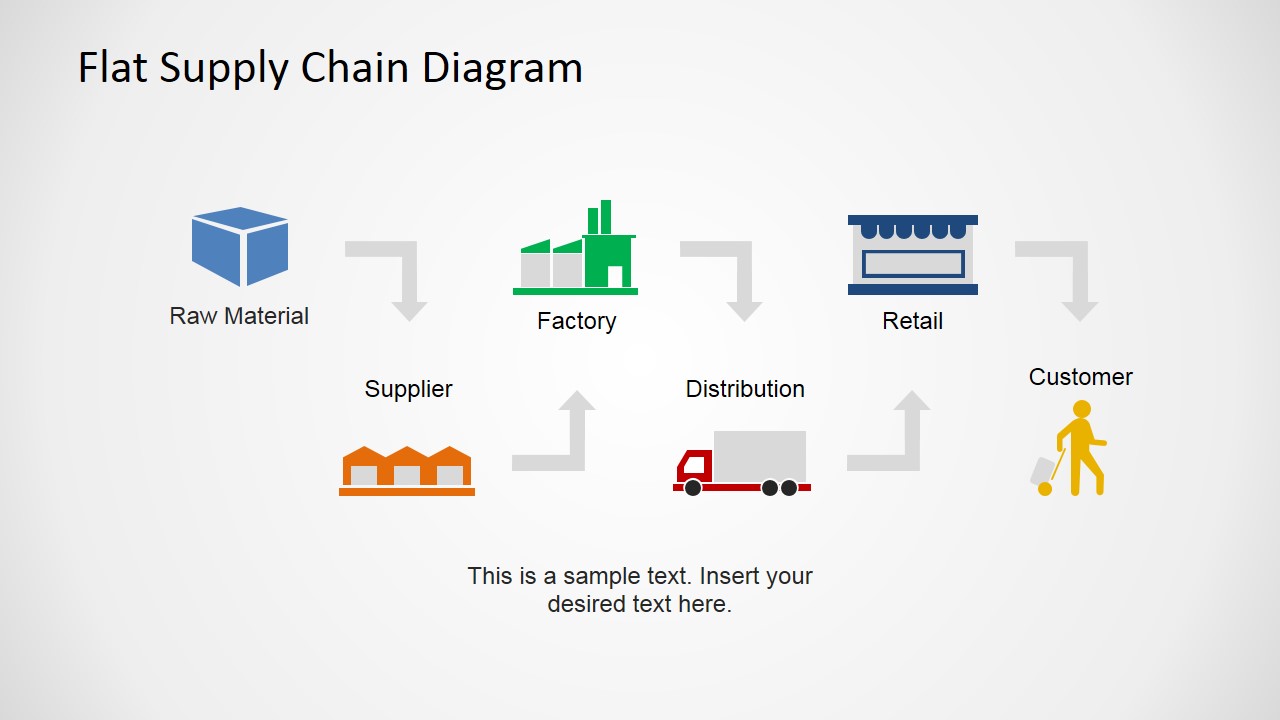
- A supply chain manager can explain an end-to-end logistics model to executives using the linear flow diagram with raw material, factory, distribution, retail, and customer icons.
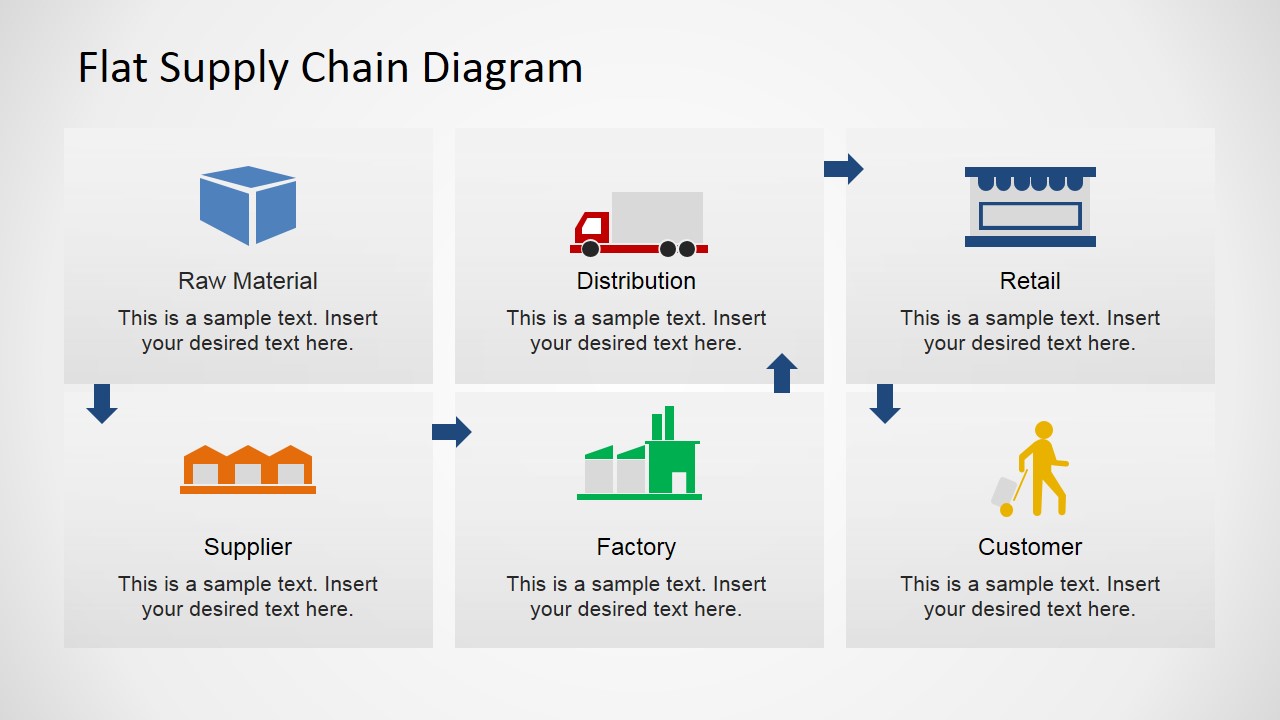
- A procurement trainer can introduce upstream and downstream dependencies to new staff using the six-step process grid and the stage-by-stage text areas.
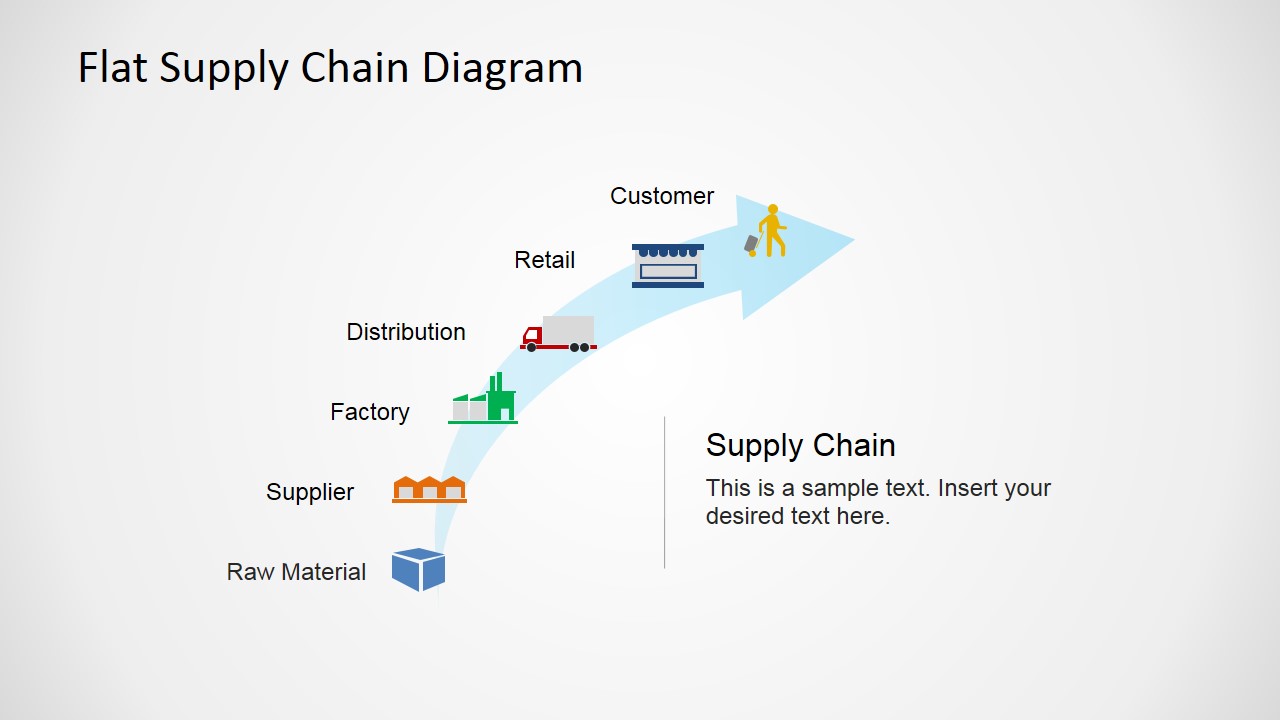
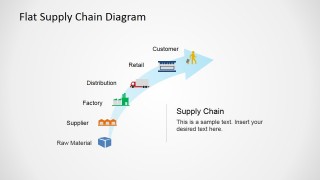
- A consultant can summarize a client's distribution network during a workshop using the upward arrow layout to show progression from source inputs to the final customer.
- A business instructor can teach basic supply chain management concepts in a seminar by replacing the sample labels with examples from manufacturing, retail, or warehousing.
Features
- 100% editable presentation template
- Compatible with Microsoft PowerPoint and Google Slides
- 16:9 aspect ratio slides
- Scalable vector shapes, icons and illustrations
- AI-Ready for Microsoft Copilot and Claude
- Instant access and download
Frequently asked questions
Q: How should a presenter use these diagrams to explain a supply chain without oversimplifying it?
A: Start with the linear flow to establish the basic movement from raw material to customer. Then use the six-step grid to add responsibilities, risks, or decisions at each stage. Finish with the upward arrow layout when the audience needs a single summary view that links the stages to value creation or delivery outcomes.
Q: Who is this template best suited for in a business presentation?
A: This template fits operations leaders, logistics teams, procurement managers, consultants, and instructors who need to explain process relationships rather than detailed performance data. It is strongest for briefings, workshops, and training sessions where the audience must quickly understand how suppliers, factories, distribution, retail, and customers connect.
Q: Why does the template use icons and directional arrows instead of a dense process map?
A: The flat icons act as visual anchors for familiar supply chain roles, while the arrows show movement and dependency. This reduces the effort needed to follow the process and keeps attention on the sequence. The upward arrow slide also works as a metaphor for progress from raw inputs to delivered value.
Flat Supply Chain Diagram for PowerPoint
3-slide supply chain diagram presentation template with logistics icons and process flow layouts
Flat Supply Chain Diagram for PowerPoint is a 3-slide diagram template for explaining product movement from raw material to customer. It includes a linear supply chain flow, a six-step process grid, and an upward value-chain arrow layout. It is built for operations, logistics, procurement, training, and management presentations in Microsoft PowerPoint and Google Slides.
- Category
- Diagrams
- Rating


 Loading...
- Aspect ratio
- 16:9, 4:3
- Item ID
- 6548-02
- Colors
 Microsoft PowerPoint
  Microsoft Copilot
  Claude for PowerPoint
 Other formats supported
Subscribe today and get immediate
access to download our PowerPoint templates.