Slide 1 of 6 from Value Chain Diagrams for PowerPoint
6208-01-value-chain-1
Value Chain Layout Diagram for Business Analysis
- Diagram
- Matrix Quadrant
- Strategic Analysis Slide
- 16:9
- 100% Editable
The Value Chain Layout from the Value Chain Diagrams for PowerPoint template offers a clear matrix quadrant diagram ideal for business presentations focused on supply chain analysis and product development. This slide template includes editable shapes and vector icons to visually map primary and support activities, enhancing strategic analysis in corporate presentation slide decks.
What’s on This Slide
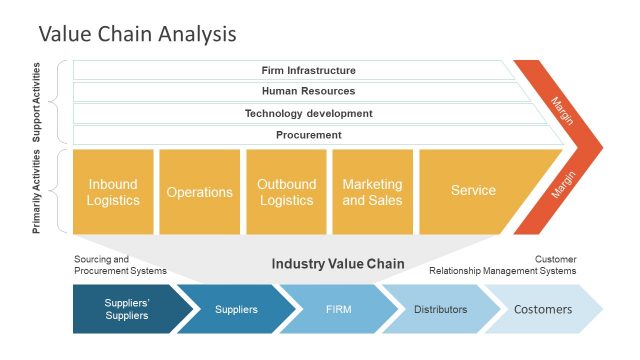
The slide features a value chain diagram with two main sections: support activities at the top and primary activities below. Support activities are represented by four horizontal bands labeled Infrastructure, Human Resource Management, Technology Development, and Procurement. Primary activities are shown in orange, divided into five segments: Inbound Logistics, Operations, Outbound Logistics, Marketing and Sales, and Service. Each section has a margin indicator on the right. Text placeholders exist for the title and labels, aligned centrally and left, respectively, with a light background enhancing visibility.
How to Use It
This layout serves as a visual representation of a value chain analysis, illustrating how various organizational activities contribute to value creation. It fits well in presentations discussing business management, operational efficiency, or strategic planning. This diagram can be used in scenarios such as analyzing supply chain processes, evaluating product development stages, or discussing customer relations strategies. It effectively communicates the interconnections between primary and support activities within a business context.
Text Placeholders & Capacity
Keep your copy within these limits so it fits without resizing. Node labels can accommodate roughly 30 characters each.
| Placeholder | Count | Max characters (approx.) |
|---|---|---|
| Slide title | 1 | 30 |
| Item heading | 9 | 30 |
Slide Keywords
Download unlimited PowerPoint templates, charts and graphics for your presentations with our annual plan.
DOWNLOADReturn to Value Chain Diagrams for PowerPoint.