Slide 2 of 4 from Upward Curves for PowerPoint
6072-04-concept-curves-upward-2
Upward Concept Curves for PowerPoint
- Diagram
- Other
- Process Slide
- 16:9
- 100% Editable
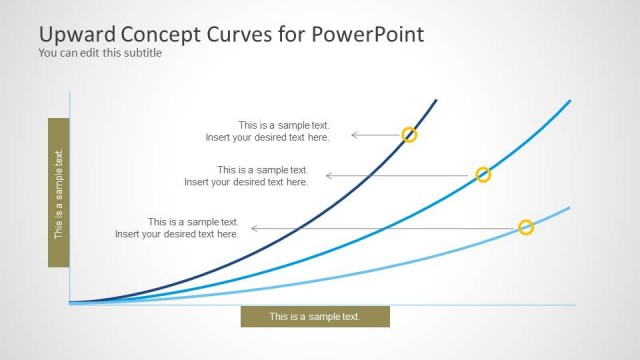
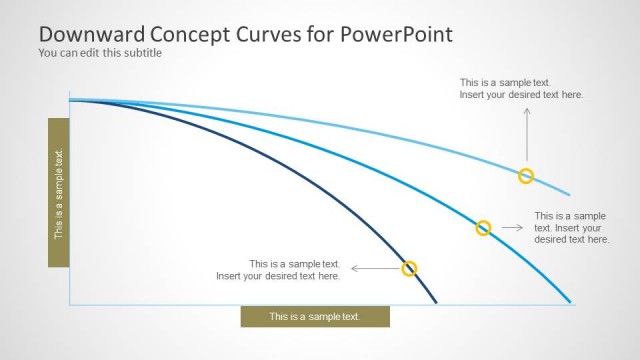
The Upward Concept Curves slide from the Upward Curves for PowerPoint template offers a clear visual tool for illustrating growth trends and project timelines. Featuring multiple ascending curves in shades of blue, this diagram slide supports business presentations that require the depiction of performance metrics or strategic progress. Its design integrates editable shapes and text placeholders, making it adaptable for corporate presentations or pitch deck templates focused on upward movement and positive trajectories.
What’s on This Slide
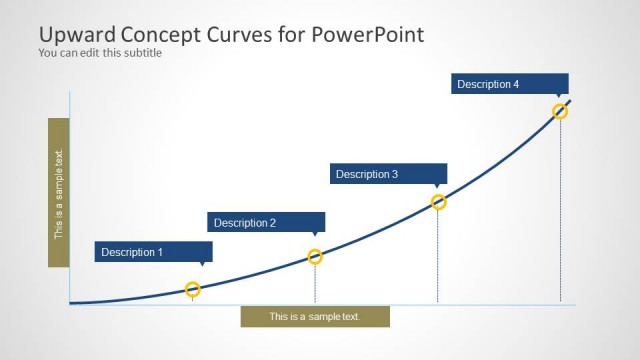
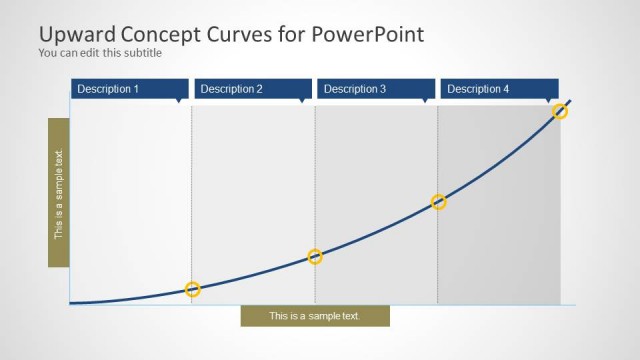
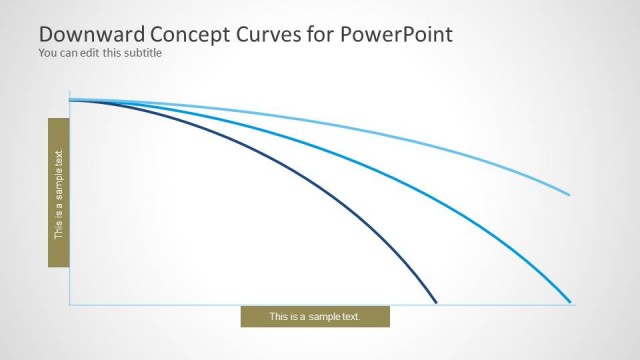
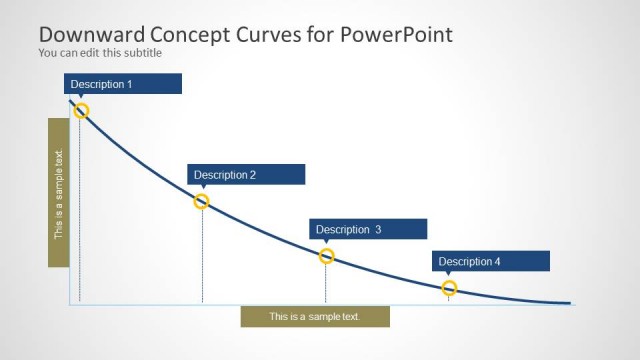
The layout features multiple upward curves in varying shades of blue, positioned diagonally across the slide. A dark blue curve is the most prominent, followed by lighter blue curves. On the left side, a vertical text placeholder is aligned, containing sample text, while another horizontal placeholder is at the bottom, also with sample text. The title is positioned at the top center, with a subtitle directly below it. The background is light, enhancing the visibility of the curves and text elements. Overall, the composition emphasizes upward movement.
How to Use It
This layout serves as a visual representation of growth or progress, making it suitable for presentations on trends, performance metrics, or strategic planning. It fits well after a problem statement slide, illustrating potential solutions or future projections. Business scenarios include showcasing sales growth, project timelines, or market trends. It can be used in various contexts, such as quarterly reports or strategic planning sessions, where upward trajectories are discussed.
Text Placeholders & Capacity
Keep your copy within these limits so it fits without resizing. Node body slots can hold about 5-6 words each.
| Placeholder | Count | Max characters (approx.) |
|---|---|---|
| Slide title | 1 | 40 |
| Subtitle | 1 | 40 |
| Item body | 2 | 30 |
| Item body | 1 | 30 |