Slide 2 of 4 from Downward Curves for PowerPoint
6072-04-concept-curves-downward-2
Downward Concept Curves for PowerPoint
- Diagram
- Other
- Process Slide
- 16:9
- 100% Editable
The Downward Concept Curves slide from the Downward Curves for PowerPoint template offers a clear visual tool for illustrating declining trends in business presentations. This slide layout features editable shapes and vector icons that help depict economic downturns or performance declines effectively. Ideal for corporate presentations and pitch deck templates, it supports professionals in communicating challenges before proposing strategic solutions.
What’s on This Slide
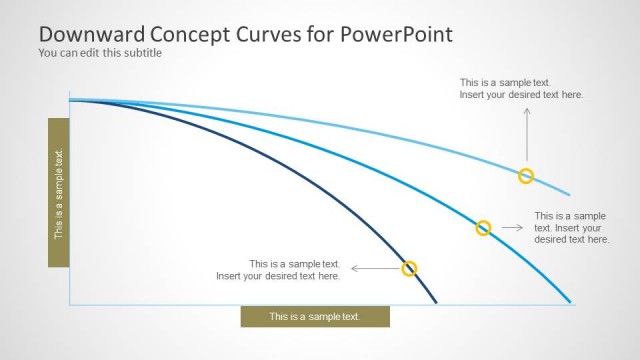
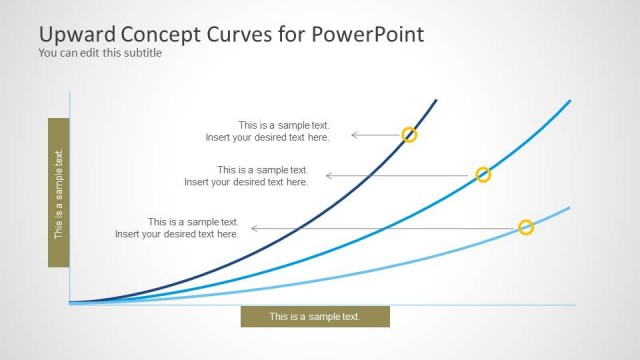
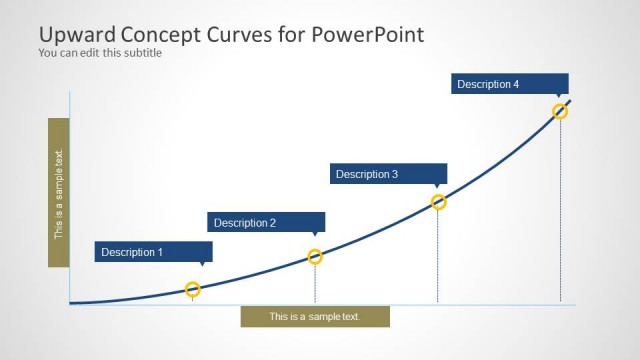
The layout features three downward curves in varying shades of blue, positioned centrally across the slide. The curves are smooth and extend from the top left to the bottom right, illustrating a decline. There are two text placeholders: one on the left side, vertically aligned, and another at the bottom center, horizontally aligned. The background is a light gradient, enhancing the visibility of the curves. The overall composition is balanced, with ample white space surrounding the curves and text, emphasizing the downward trend.
How to Use It
This layout serves as a visual representation of declining trends, making it suitable for presentations discussing downturns in business metrics, economic recessions, or performance declines. It fits well after problem framing slides and before solutions or strategies. Business professionals can use it to illustrate negative trends in sales, market performance, or project outcomes, providing a clear visual context for discussions on recovery or strategic pivots.
Text Placeholders & Capacity
Keep your copy within these limits so it fits without resizing. Text slots can accommodate short phrases, roughly 3-5 words each.
| Placeholder | Count | Max characters (approx.) |
|---|---|---|
| Slide title | 1 | 30 |
| Subtitle | 1 | 30 |
| Item body | 2 | 20 |
Slide Keywords
Download unlimited PowerPoint templates, charts and graphics for your presentations with our annual plan.
DOWNLOADReturn to Downward Curves for PowerPoint.