Slide 1 of 4 from Downward Curves for PowerPoint
6072-04-concept-curves-downward-1
Downward Concept Curves for PowerPoint
- Diagram
- Other
- Process Slide
- 16:9
- 100% Editable
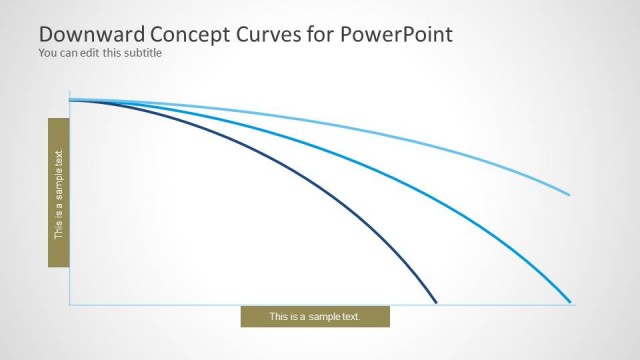
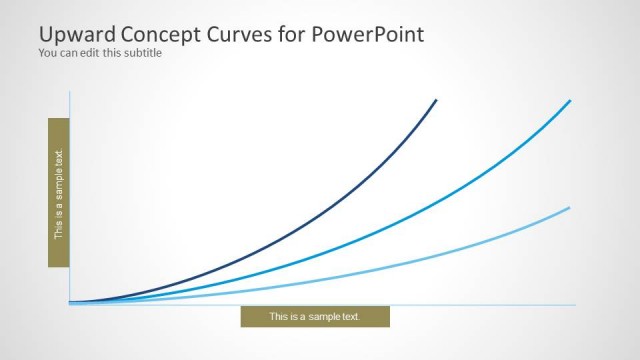
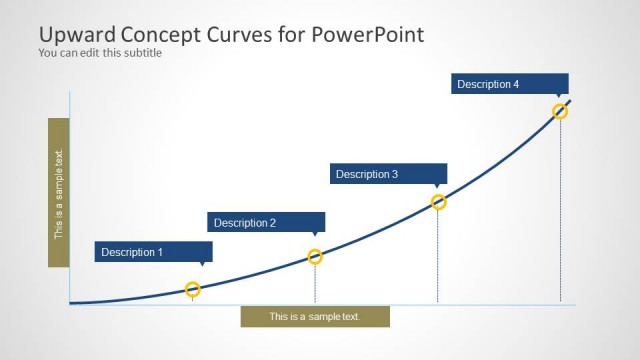
The Downward Concept Curves slide from the Downward Curves for PowerPoint template provides a clear visual tool for illustrating performance decline and market downturns. This slide layout, part of a professional business presentation, uses editable shapes and vector icons to highlight key points along descending curves. It is well suited for corporate presentations or pitch deck templates that require a focused depiction of negative trends or project setbacks.
What’s on This Slide
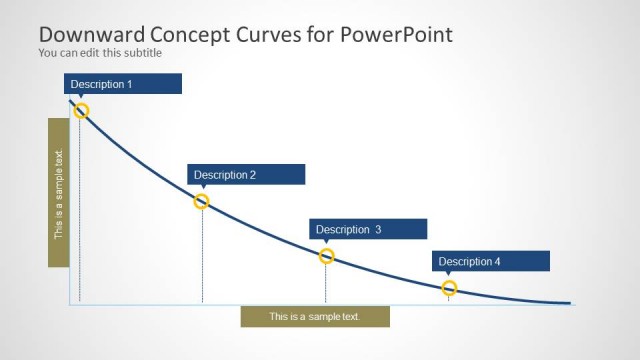
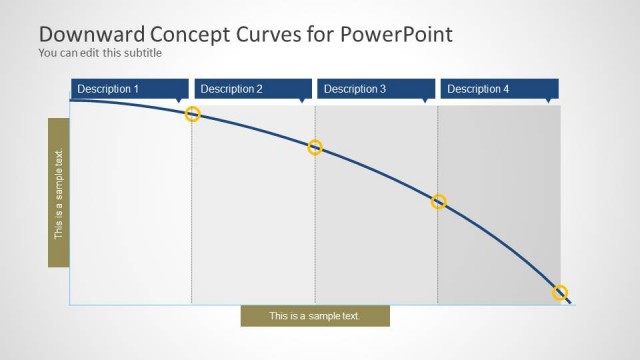
The layout features a light background with a series of downward-curving lines, each in varying shades of blue. The curves represent a decline, arranged from left to right. There are four text placeholders positioned strategically: one on the left, one at the bottom center, and two along the curves. The left placeholder is vertically aligned, while the bottom and curve placeholders are horizontally aligned. Each curve has circular markers indicating points of interest, enhancing the visual hierarchy. The overall composition is clean and emphasizes the downward trend.
How to Use It
This layout serves as a visual representation of declining trends or negative performance metrics. It fits well in presentations discussing recession, crisis, or any scenario involving downward trajectories. The arrangement allows for clear communication of complex ideas through visual means. It can be used in business contexts to illustrate performance drops, market declines, or project setbacks, making it suitable for financial reports or strategic discussions.
Text Placeholders & Capacity
Keep your copy within these limits so it fits without resizing. Node body slots can hold about 5-6 words each.
| Placeholder | Count | Max characters (approx.) |
|---|---|---|
| Slide title | 1 | 40 |
| Subtitle | 1 | 40 |
| Item body | 4 | 30 |
Slide Keywords
Download unlimited PowerPoint templates, charts and graphics for your presentations with our annual plan.
DOWNLOADReturn to Downward Curves for PowerPoint.