Slide 2 of 3 from J-Curve for PowerPoint
6123-01-j-curve-2
J-Curve Diagram for PowerPoint
- Diagram
- Other
- Concept Explanation Slide
- 16:9
- 100% Editable
The J-Curve Diagram slide from the J-Curve for PowerPoint template provides a clear visual tool for illustrating growth patterns and trend forecasting. Designed for business presentations, this slide uses editable shapes and vector icons to highlight performance analysis and strategic planning concepts effectively within a clean layout.
What’s on This Slide
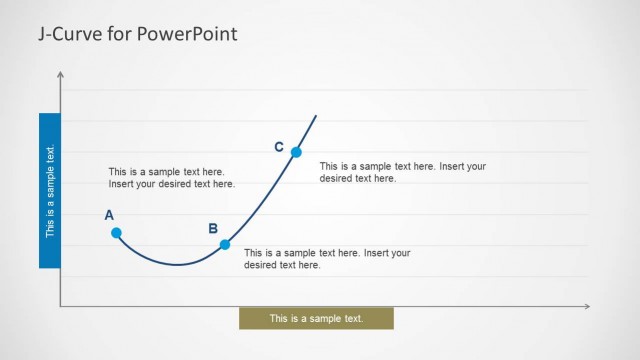
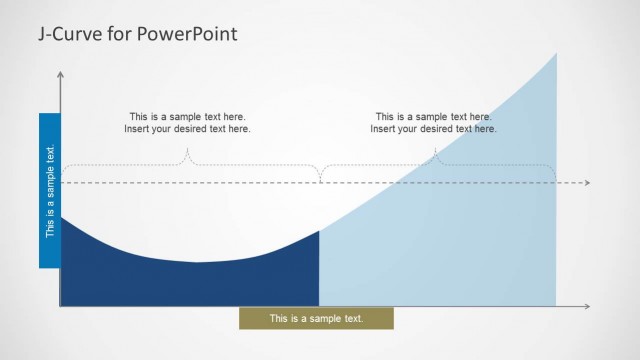
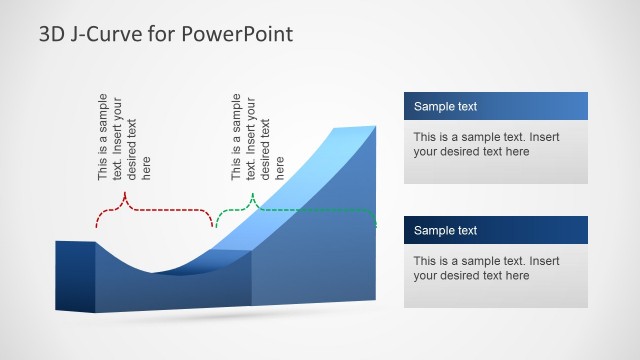
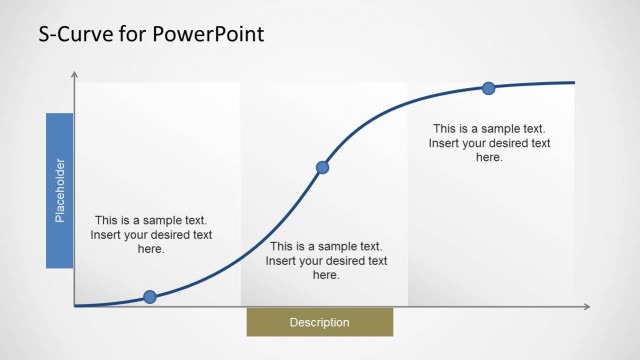
The slide features a J-curve diagram positioned centrally, illustrating a growth pattern. The curve is solid and dashed, indicating different trends. Text placeholders are located on the left, bottom, and within the curve, with the left text aligned vertically and the bottom text centered. The background is light, enhancing visibility. The visual hierarchy emphasizes the J-curve, with the solid line appearing more prominent than the dashed line. The overall layout is clean, allowing for clear communication of the concept.
How to Use It
This layout serves as a visual representation of J-curve behavior, suitable for illustrating concepts in economics or social science. It fits well after a problem slide to show potential recovery or growth trajectories. This diagram can be used in business presentations to discuss performance analysis, strategic planning, or trend forecasting, making it effective for stakeholders needing to understand complex dynamics in a straightforward manner.
Text Placeholders & Capacity
Keep your copy within these limits so it fits without resizing. Body slots can hold roughly 8-10 words each.
| Placeholder | Count | Max characters (approx.) |
|---|---|---|
| Slide title | 1 | 30 |
| Body paragraph | 4 | 50 |
Slide Keywords
Download unlimited PowerPoint templates, charts and graphics for your presentations with our annual plan.
DOWNLOADReturn to J-Curve for PowerPoint.