Slide 4 of 5 from Thermometer Shapes for PowerPoint
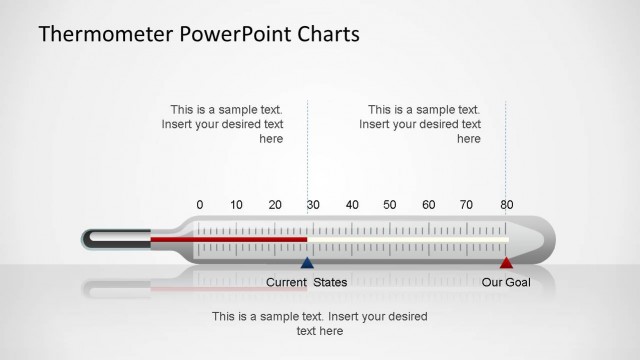
Lateral Thermometer Shapes for PowerPoint
Thermometer Shapes for PowerPoint Presentation
- Diagram
- Other
- Evaluation Slide
- 16:9
- 100% Editable
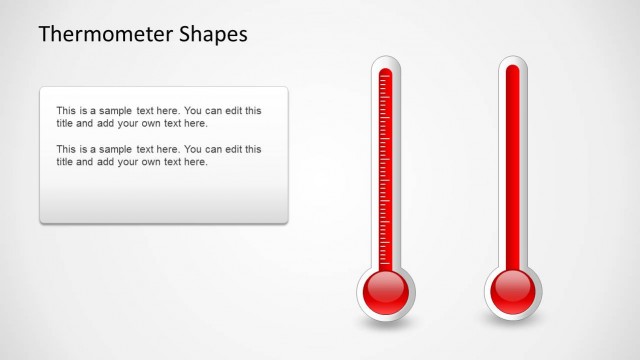
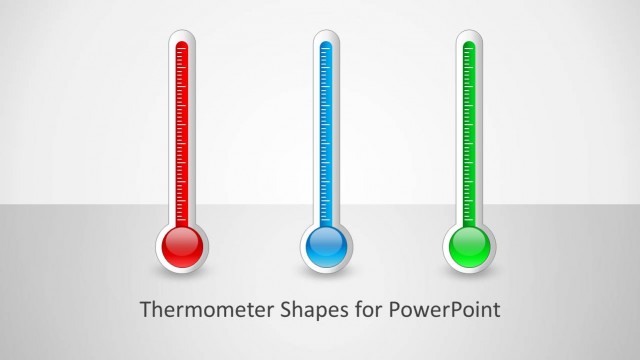
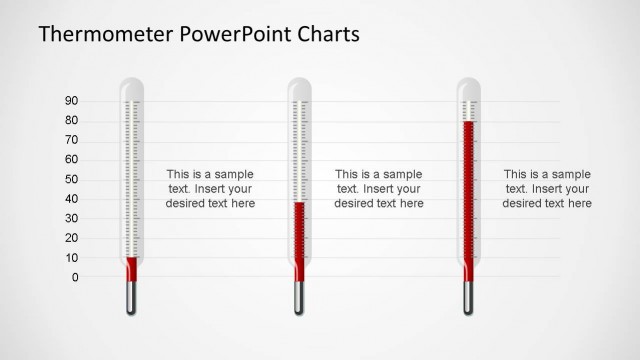
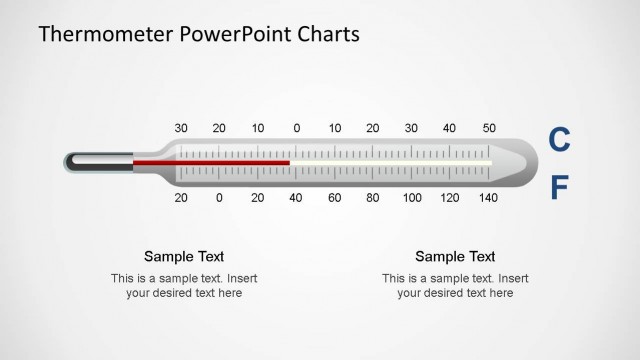
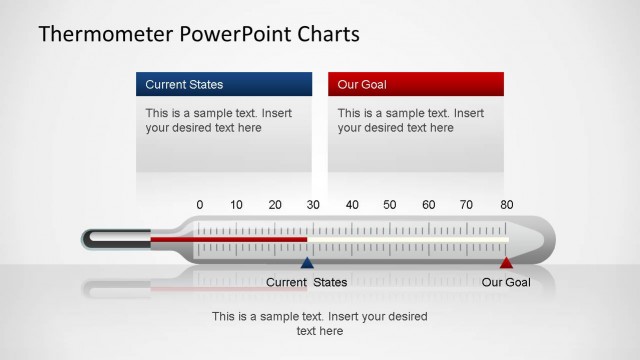
The Thermometer Shapes slide from the Thermometer Shapes for PowerPoint template provides a clear visual tool for evaluating KPIs and project statuses. This slide layout uses editable shapes and vector icons to depict positive, negative, and neutral levels, making it suitable for business presentations and corporate slide decks that require precise performance evaluation. Its design supports effective communication of progress and milestones within pitch deck templates or Google Slides templates.
What’s on This Slide
The layout features three horizontal thermometer shapes aligned vertically. The top thermometer is green, indicating a positive level, while the middle thermometer is red, showing a negative level. The bottom thermometer is blue, representing a neutral or different level. To the right, there is a rectangular text placeholder with rounded corners, positioned centrally, allowing for a title and body text. The background is light with subtle gradients, enhancing the visibility of the thermometers. Each thermometer has a circular end cap, contributing to a cohesive design.
How to Use It
This layout serves as a visual representation of levels or progress, suitable for business presentations. It fits well after a problem slide, illustrating current status or performance metrics. Use it to display KPIs, project milestones, or survey results. The thermometer shapes can effectively communicate varying degrees of achievement or status, making it ideal for progress reports or performance evaluations. It is best used when clear visual differentiation of levels is needed.
Text Placeholders & Capacity
Keep your copy within these limits so it fits without resizing. Body slots can hold about 25-30 words each.
| Placeholder | Count | Max characters (approx.) |
|---|---|---|
| Slide title | 1 | 30 |
| Body paragraph | 2 | 150 |
Slide Keywords
Download unlimited PowerPoint templates, charts and graphics for your presentations with our annual plan.
DOWNLOADReturn to Thermometer Shapes for PowerPoint.