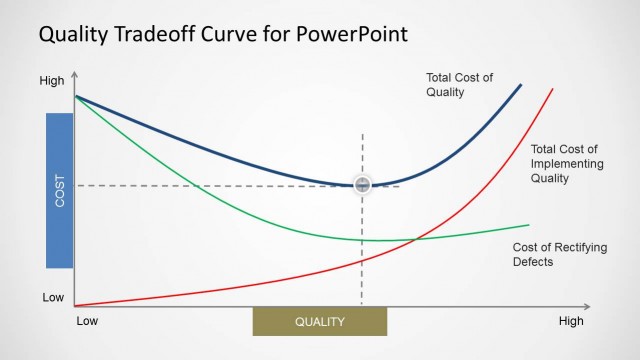
Taguchi’s Quality Loss Function Curve PowerPoint Template
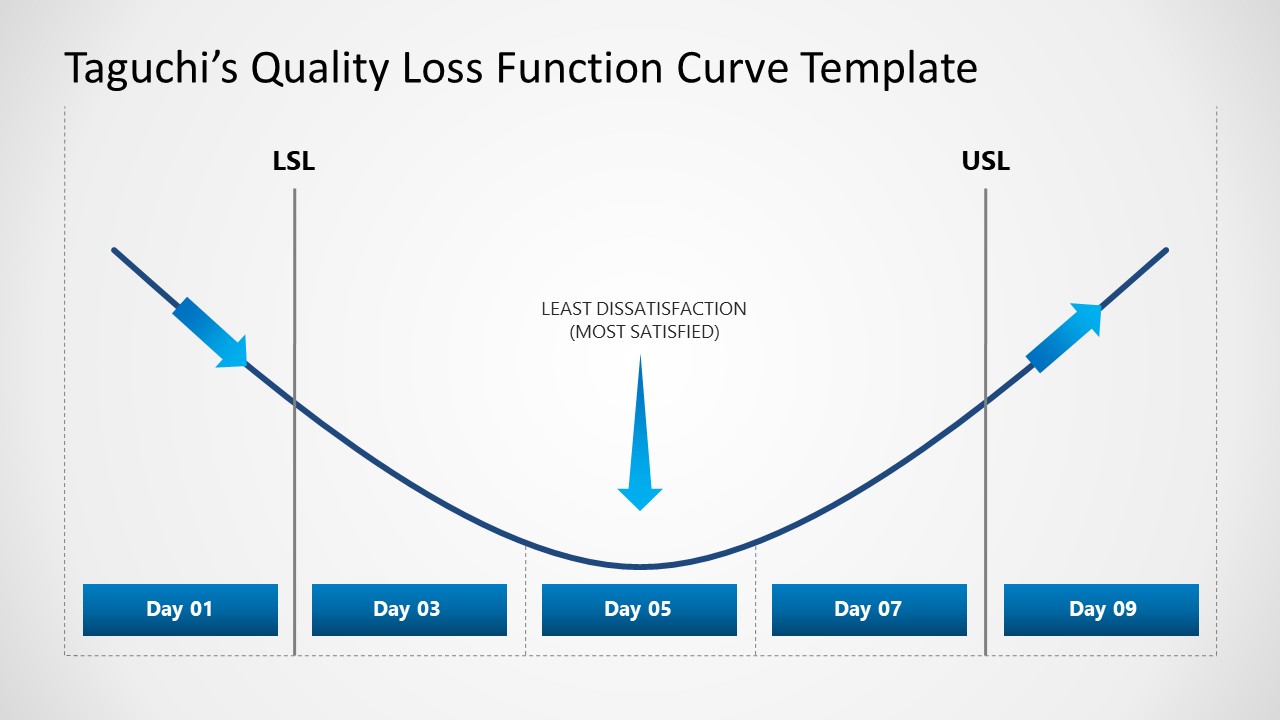
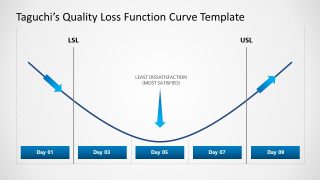
The Taguchi’s Quality Loss Function Curve PowerPoint Template is a graphical figure for presenting the concept of the Taguchi Quality Loss function and its application. Japanese business statistician Genichi Taguchi proposed this concept for manufacturers to increase the quality of products and services. It indicates that economic loss can be reduced by keeping the variations within the acceptable or prioritized range. In other words, if a product doesn’t meet customer requirements, customer dissatisfaction increases exponentially. To demonstrate this concept graphically, Taguchi has used a parabola with two limits: USL (upper specification level) and LSL (Lower specification level). This expression also indicates the increase in customer dissatisfaction when the factors move away from the central or most satisfied point. We have created this 100% editable slide template with Taguchi’s graph diagram.
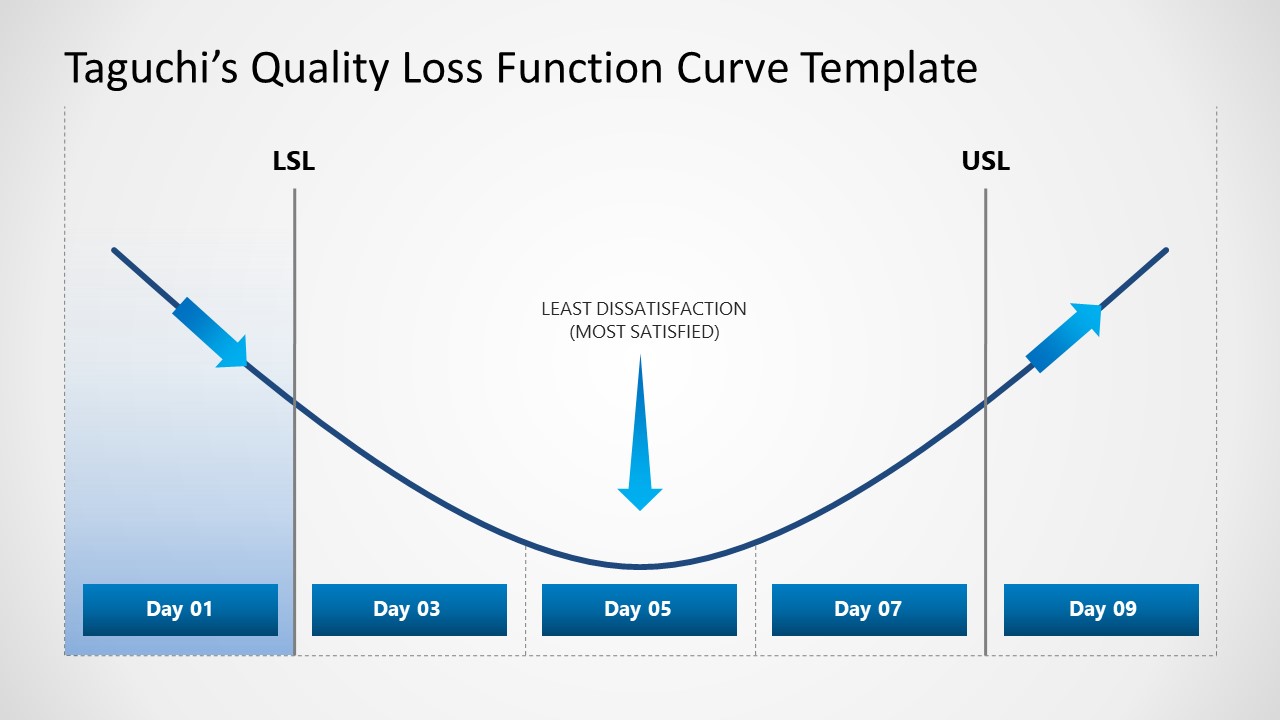
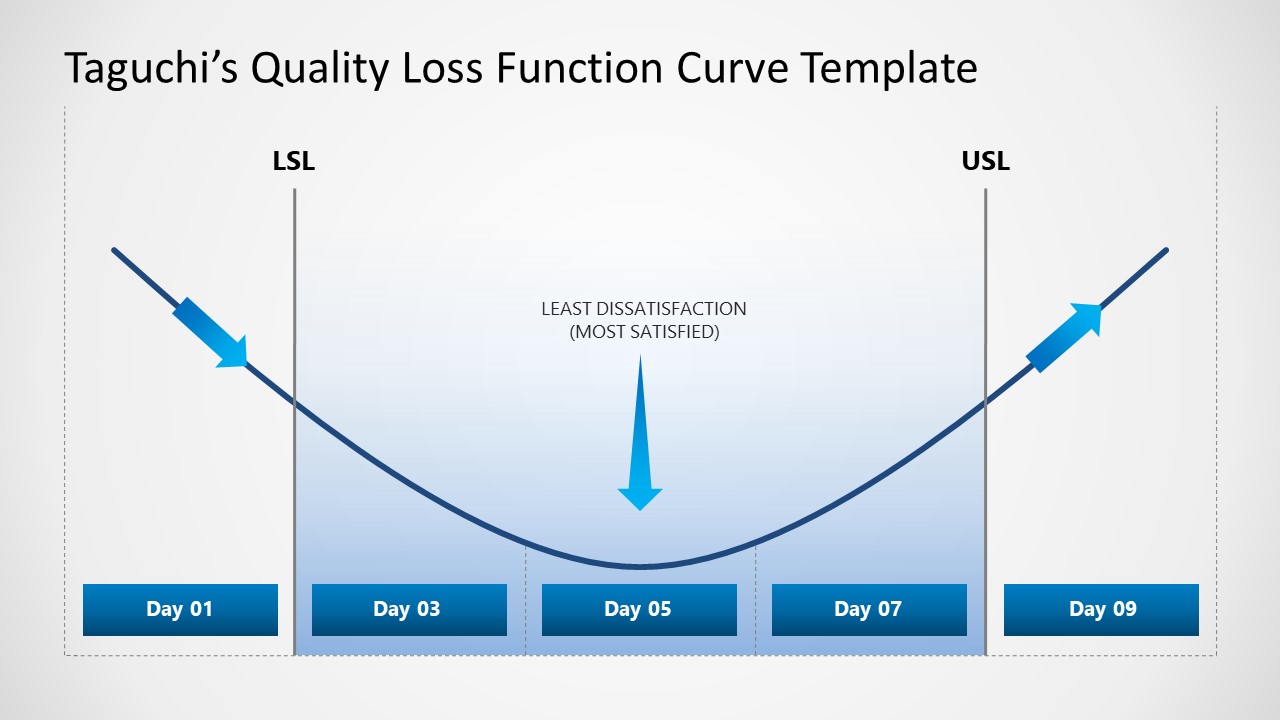
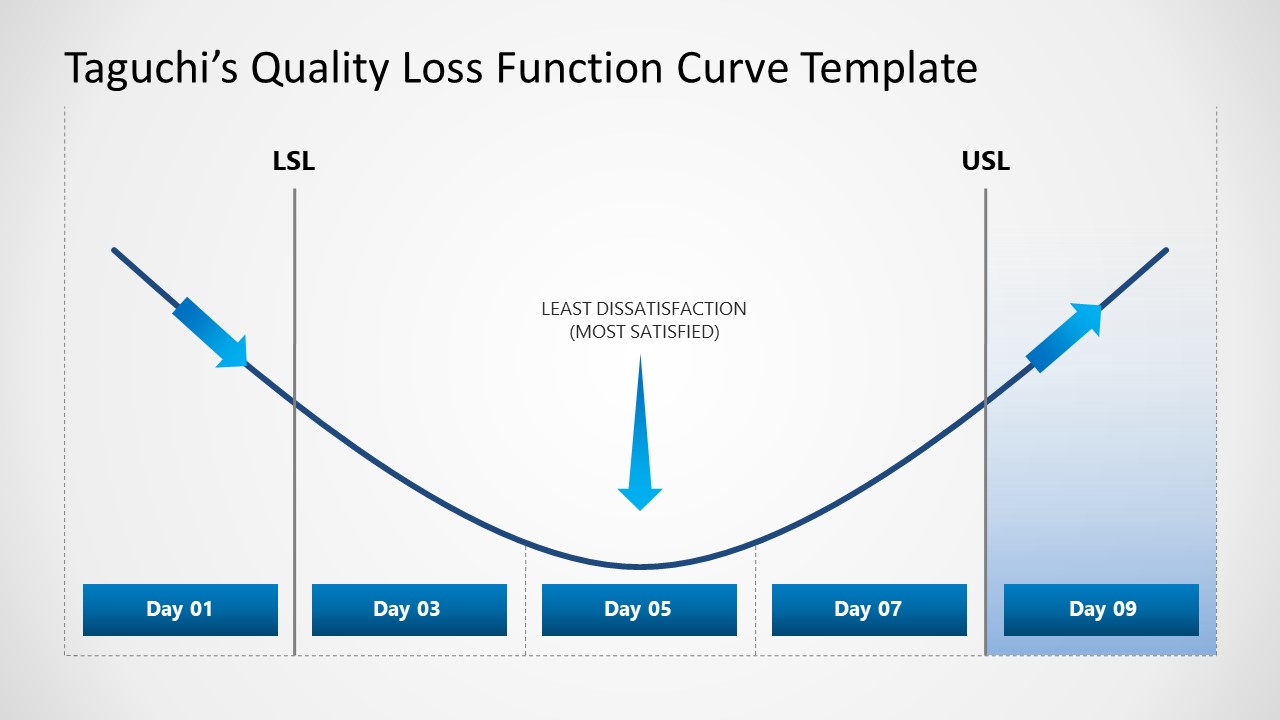
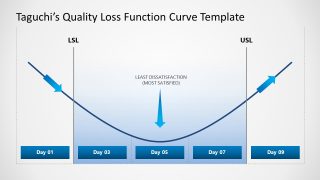
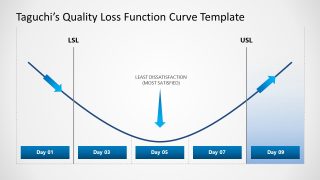
The first slide of Taguchi’s Quality Loss Function Curve PowerPoint Template carries a parabola graphical shape with three segments. One part is on the left side of the curve, the other is the graph’s area, and the third is after the curve. The extreme sides represent the areas of LSL and USL limits or unsatisfied customer groups. On the x-axis are labels for days 1, 2, 3, 4, and 5 onwards. We have used them as indicators of the best usage time of a food product. Professionals can also discuss them as five possible variations of the quality. The first slide shows this diagram with text boxes and editable placeholders. The following three slides color highlight the individual segments one by one. The central point has a downward to mention the scenario’s primary or most satisfied point. Users can change the labels and add description text according to their requirements.
This template can be helpful when discussing the importance of Taguchi’s methodology in production and manufacturing. Business professionals can also include this graph in their meeting presentations about quality control. Download and try editing this PPT template now!

You must be logged in to download this file.
DOWNLOAD- Category
- Models
- Rating

 Loading...
- Size
- 16x9
- Item ID
- 22123-01
- Colors
Subscribe today and get immediate
access to download our PowerPoint templates.