Failure Rate Curve Template for PowerPoint
Failure Rate Curve for PowerPoint is a presentation curve representing the popular Bathtub Curve used to describe the product failure behavior and useful to make PowerPoint presentations.
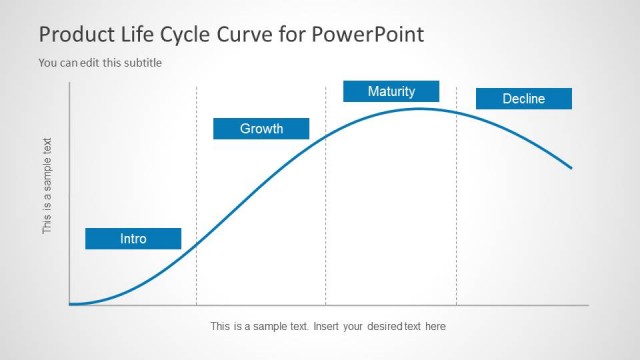
You can use this curve to describe the lifetime of a population of products using a graphical representation. The Bathtub Curve consists of three phases or periods: an infant mortality period with a decreasing failure rate followed by a normal life period with a low. During the second period it is common to find a constant failure rate. Then the third period is named the wear-out period that exhibits an increasing failure rate.
If you are looking for a Failure Rate Curve template for PowerPoint or Bathtub curve design for presentations then this presentation curve for PowerPoint can be useful.


You must be logged in to download this file.
DOWNLOAD- Category
- Curves & Lines
- Rating


 Loading...
- Item ID
- 6281-01
- Colors
Subscribe today and get immediate
access to download our PowerPoint templates.