Decision Tree PowerPoint Templates & Presentation Slides
Download 100% editable decision tree PowerPoint templates and slide designs for creating presentations that require creative decision tree diagrams and probability trees. These diagrams help visualize decision paths and their consequences.
Our PowerPoint decision tree map templates allow you to present your decision-making process and the alternatives in each step. Choose from a range of professional decision tree templates to give a lasting impression of your decision-making process.
Featured Templates

Multi-Level Segmentation Tree Diagram for PowerPoint

Simple Organizational Chart Template for PowerPoint

Decision Tree Diagram with Text Boxes for PowerPoint

Decision Tree Diagram for PowerPoint
Latest Templates

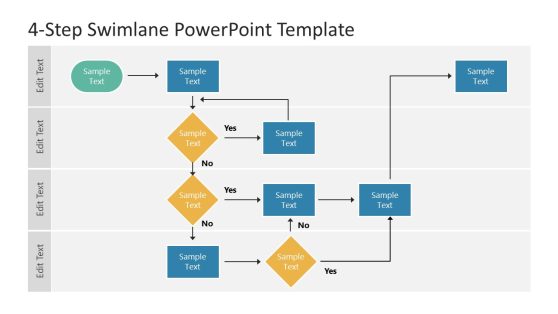
4-Step Swimlane PowerPoint Template

Opportunities Solution Tree PowerPoint Template

Brain Tree PowerPoint Template
SlideModel Decision Tree Templates include flowcharts and decision-making diagrams depicting binary trees or multi branch trees. Simply choose the template that best fits your presentation style and adjust with your own decision paths.
You can also check out the free decision tree templates such as horizontal decision tree in free templates catalog.
Download 100% editable decision tree analysis templates compatible with Microsoft PowerPoint & Google Slides presentations. Our decision tree diagrams have different layouts and styles. You can also learn how to make your own decision tree designs in PowerPoint or reuse one of our existing decision tree diagram templates to save time.
What is a Decision Tree?
A decision tree is a breakdown of possibilities for decision-making analysis in a tree-like structure. It is used to determine a course of actions or statistical probability.
Decision tree charts create a question sequence and classifies the outcome of each step based on true and false answers. The flow structure starts from a decision node i.e. a question or attributes with at least two branches. These branches show potential decisions and their outcomes (branches) or reactions. Each possibility in the decision tree has an assigned risk and reward associated. This information helps assess the pros and cons leading to the final outcome.
Executives apply Decision Tree maps to measure actions based on costs, probabilities, and benefits. It can be used in simple and complex business decisions to define a course of action. There are two types of tree-diagram approaches based on target variables; a- categorical and b-continuous variable decision tree. In categorical decision-trees, decisions are made based on yes-no answers. The continuous decision-trees, on the other hand, predict the outcome based on available pieces of information.
What is the Decision Tree PowerPoint Template?
A decision tree PowerPoint template is a pre-created editable tree structure in PowerPoint you can edit and populate with your own decision paths. The template provides means to add or remove decision branches as well as more questions joints. Making a decision tree can get complicated. SlideModel’s decision tree diagrams are created with usability in mind, so users can quickly achieve their required tree structure in a few clicks. Our PowerPoint Templates are not only easy to edit but also designed following presentation best practices, taking most of the slide canvas space. The use of a decision tree template provides a framework, enabling users to explain their decision making process with the appropriate visual reference.
PowerPoint decision tree templates are created in a hierarchical approach. When you want to discuss possible scenarios or business decisions, decision tree PPT templates help you visualize problems and possible outcomes. The SlideModel catalog of diagrams includes a range of layouts for tree chart illustration, Yes-no decision tree, and project decision tree. These decision tree PowerPoint templates support strategic decisions of business, science, and other industries.
How can Decision Tree PowerPoint Template be used in a presentation?
A presenter may require a decision tree diagram template for three main purposes:
Explain decision trees – definition and purpose
A presenter will create concrete and abstract examples of decision trees using a decision tree template in order to inform the audience about the definition and usage of a decision tree. This is a typical use case of academia and management courses. The presenter can use different layouts (vertical or horizontal) as well as different styles (flat, 3D) to showcase the different structure components and its usage.
Persuade an audience of a decision to be made
The presenter has carried out a formal decision making process, analyzed the different paths and outcomes, and has identified the paths that are most likely to provide positive outcomes. Now it needs to persuade an executive audience. The user can describe its decision tree using one of our decision tree templates.
Evaluate Different decision trees.
Depending on the decision making process followed, and the variables analyzed, several decision trees can be created for the same set of initial scenarios. In order to reach an agreement with the team, the presenter will create the different decision trees to showcase the analyses and evaluate the pros and cons of each tree – path.
Statistical or Mathematical Applications
Decision trees (as an abstract data type) are used for classification and regression models in machine learning algorithms, especially in data mining concepts. The PowerPoint decision tree diagram can highlight the prediction values for the decision-making process in order to explain to the audience the level of depth an algorithm can take and the number of possible branches.
Benefits of SlideModel Decision Tree Diagrams
Easy to read
The decision-tree charts are used by individuals and businesses alike as their output is easy to read without lengthy reasoning.
Data classifications
Without going into the complex calculations, decision-tree charts help classify data and predict target variables.
Use with other decision-making techniques
For complex situations, the decision-tree can be combined with other methods to reach a decision.


