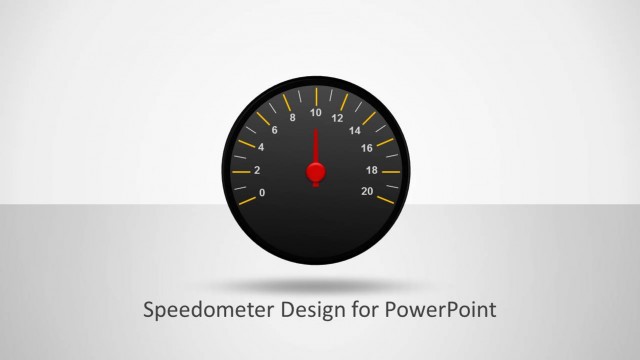
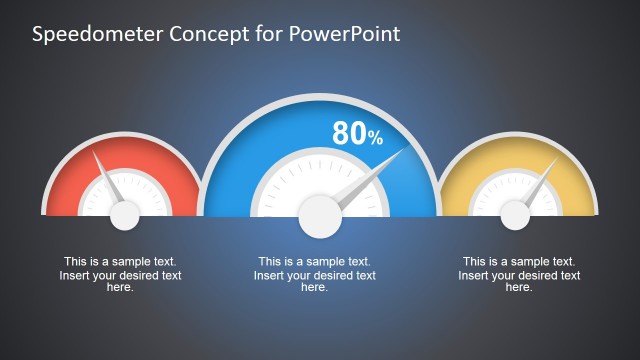
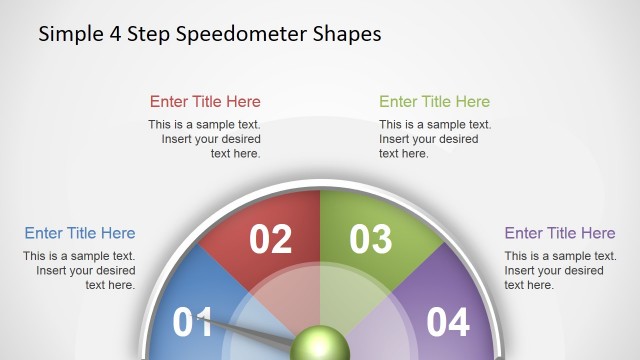
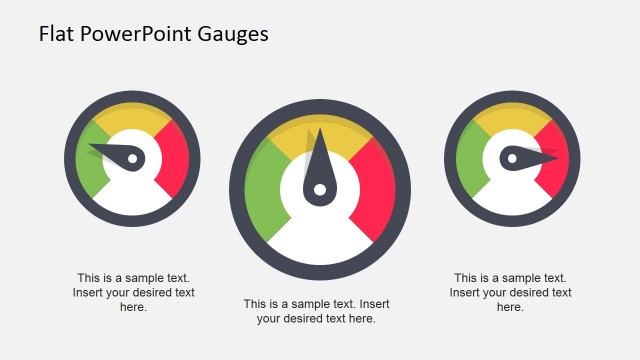
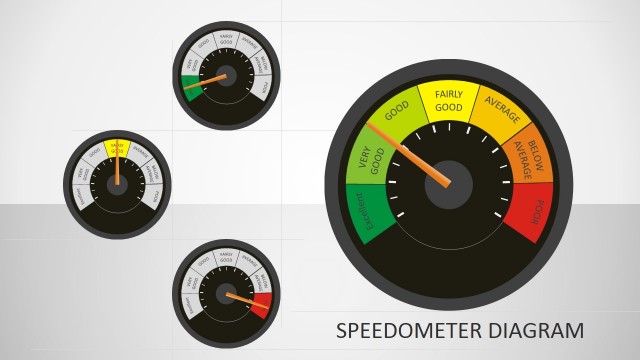
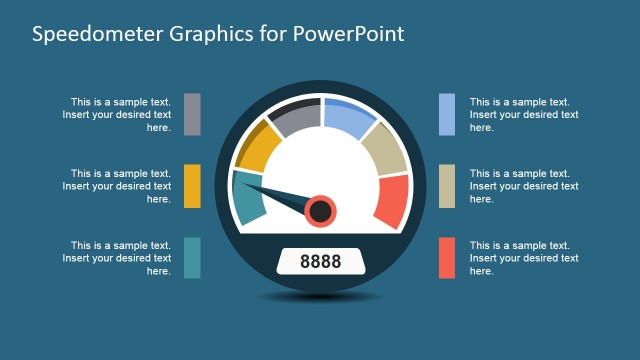
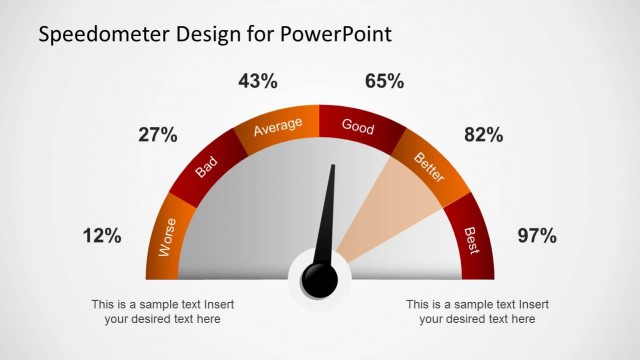
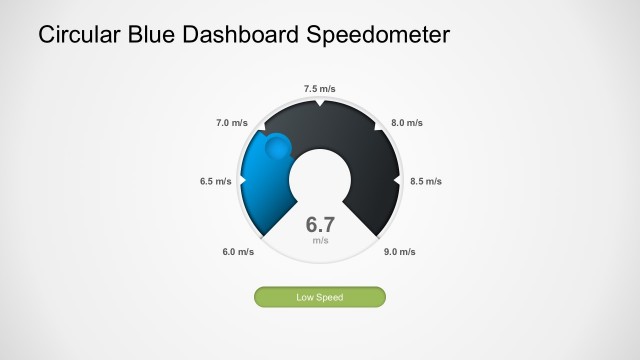
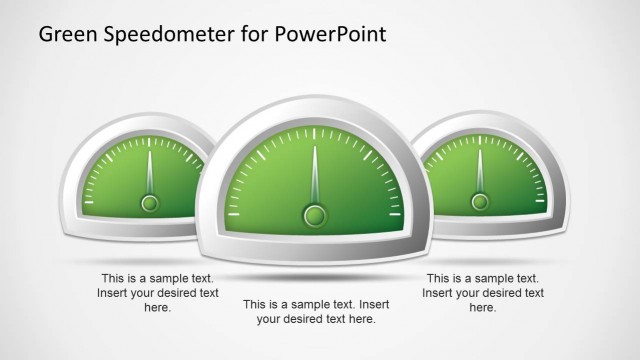
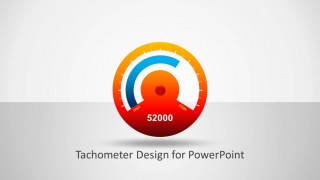
Tachometer Shape for PowerPoint is a simple presentation template containing a speedometer illustration that you can use in presentations. You can make awesome dashboards with this tachometer shape for Microsoft PowerPoint presentations. Users can employ the Microsoft Clip Art in any existing presentations just with Drag and Drop.
Tachometer PowerPoint template contains an editable tachometer slide design with adjustable needle that was created using PowerPoint shapes. Alternatively you can download other speedometer PowerPoint templates and dashboard for PowerPoint.
What’s inside this template
Example presentation scenarios
- An operations manager can present current process performance to executives by placing the main KPI in the tachometer and explaining three drivers with the light dashboard label layout.
- A sales leader can show progress toward a quota by using the standalone gauge slide as a status snapshot before moving into detailed sales reporting.
- A consultant can summarize risk, maturity, or readiness for a client steering committee with the dark dashboard layout and its three supporting label blocks.
- A business analyst can introduce a KPI dashboard section by using the tachometer as the lead visual and reserving the label areas for definitions, thresholds, and next actions.
Features
- 100% editable presentation template
- Compatible with Microsoft PowerPoint and Google Slides
- 16:9 aspect ratio slides
- Scalable vector shapes, icons and illustrations
- AI-Ready for Microsoft Copilot and Claude
- Instant access and download
Frequently asked questions
Q: How should a presenter explain the gauge without oversimplifying the KPI?
A: Use the tachometer as the headline status signal, then assign the three label blocks to context: what is being measured, why the current value matters, and what action follows. Avoid treating the gauge as proof by itself. Pair the visual with a clear threshold, comparison point, or target statement.
Q: Which presentation situations fit this tachometer template best?
A: This template fits brief status updates where one measure needs immediate attention, such as operational readiness, sales progress, risk level, service performance, or maturity scoring. It is strongest for managers, analysts, and consultants who need an executive-friendly KPI snapshot before discussing causes, actions, or next steps.
Q: Why does the tachometer metaphor work for dashboard communication?
A: A tachometer implies direction, intensity, and acceptable operating range, so the audience can read status quickly without studying a table. The min and max labels, needle position, and warm color scale create a familiar performance metaphor. The supporting labels prevent the symbol from becoming decorative by adding interpretation.
Tachometer Shape for PowerPoint
3-slide presentation template with editable tachometer gauge and KPI dashboard label layouts
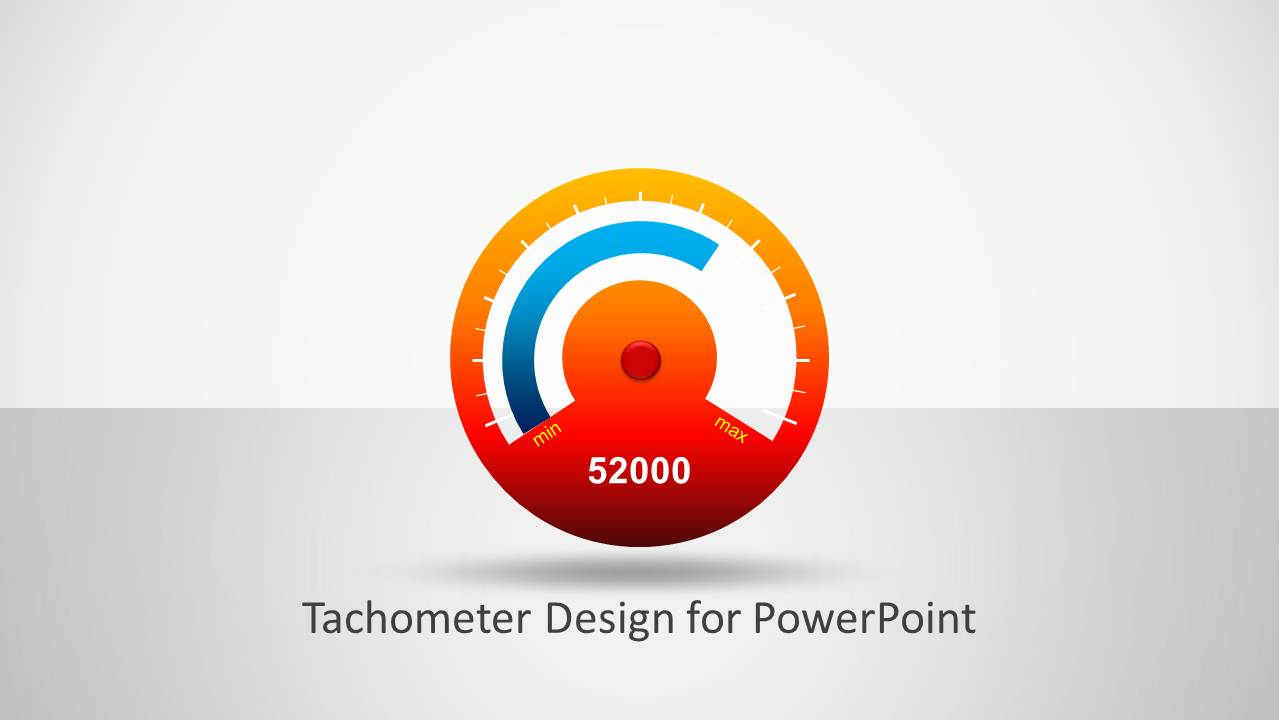
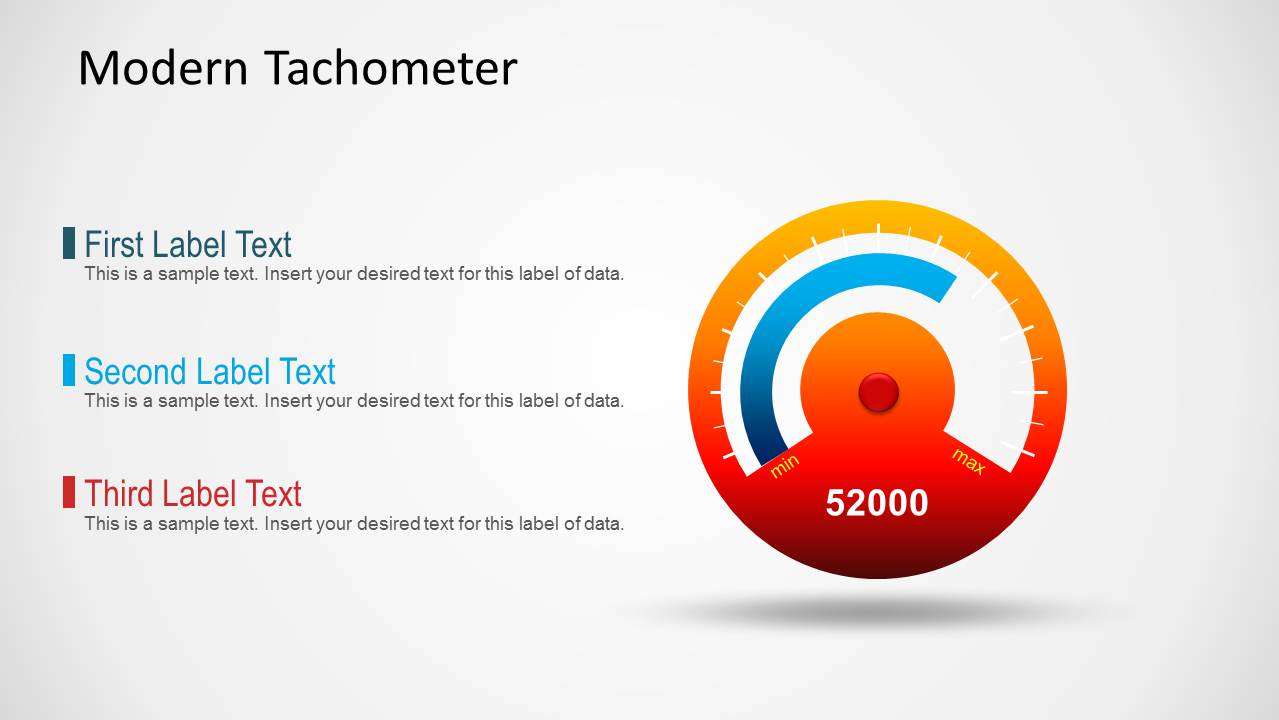
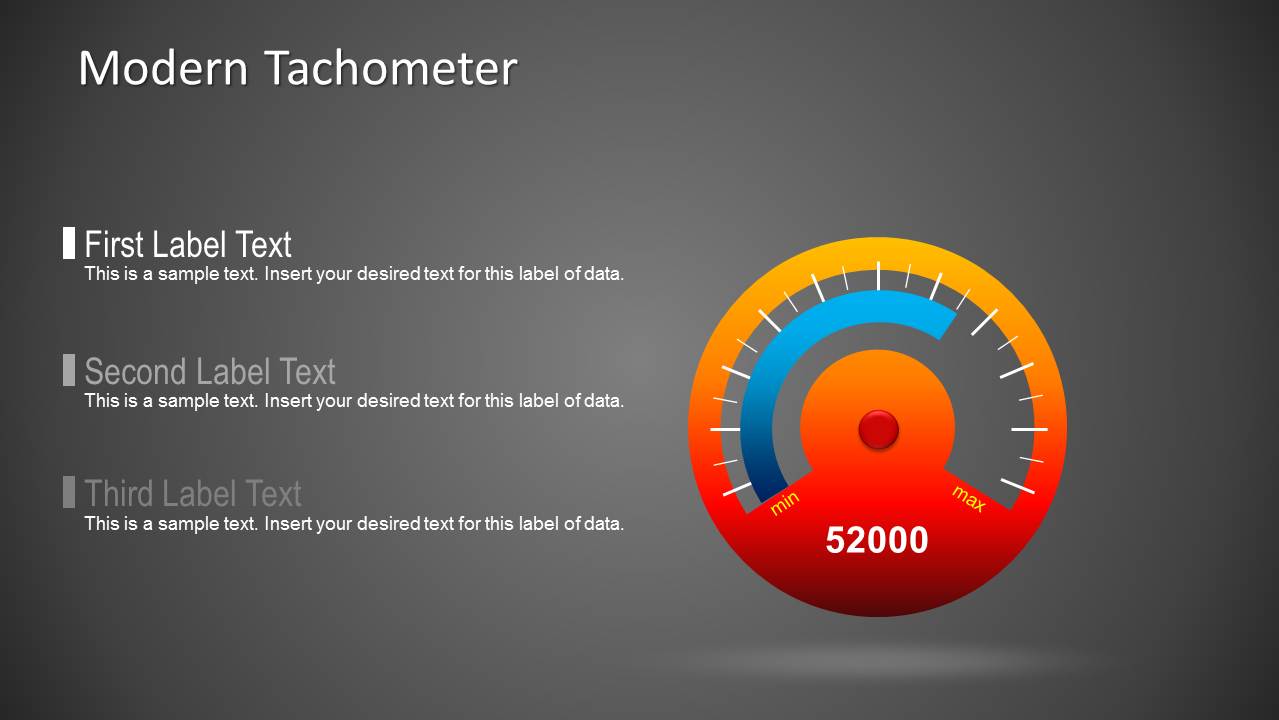
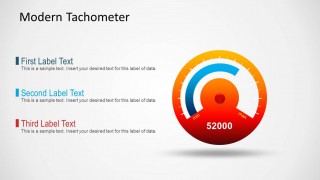
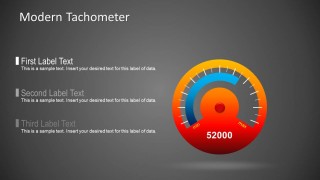
Tachometer Shape for PowerPoint is a 3-slide gauge presentation template for KPI, dashboard, and status reporting. It includes a standalone tachometer cover, a light dashboard layout with three text labels, and a dark dashboard layout with the same gauge-label structure. The editable PowerPoint shapes and vector graphics work in Microsoft PowerPoint and Google Slides.
- Category
- Shapes
- Rating


 Loading...
- Aspect ratio
- 16:9, 4:3
- Item ID
- 9502
- Colors
 Microsoft PowerPoint
  Microsoft Copilot
  Claude for PowerPoint
 Other formats supported
Subscribe today and get immediate
access to download our PowerPoint templates.