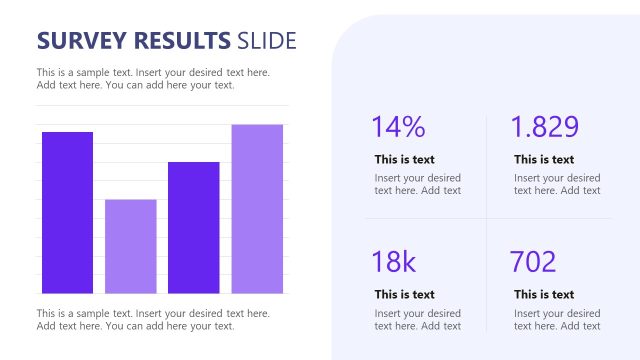
Slide 14 of 15 from Survey Presentation Template
Scenario-based Survey PPT Presentation Template
Survey Results Comparison Slide
- Chart
- Other
- Evaluation Slide
- 16:9
- 100% Editable
The Survey Results Comparison slide from the Survey Presentation Template offers a clear visual layout for demographic comparison and market research analysis. This slide template features editable shapes and vector icons to highlight differences in survey data effectively, making it a valuable addition to any business presentation or pitch deck template focused on survey results.
What’s on This Slide
The layout features two side-by-side sections, each containing a percentage figure prominently displayed at the top. The left section shows a 60% figure with a purple theme, while the right section displays a 40% figure in red. Below each percentage, there are text placeholders for additional information, aligned centrally. Each section includes a row of icons representing male and female figures, respectively, with the male figures in purple and female figures in red. The background is light with a subtle gradient, enhancing visual separation.
How to Use It
This layout serves to compare survey results, particularly demographic data, such as gender distribution. It fits well in a presentation sequence following data analysis slides, providing a clear visual representation of findings. This structure is useful in business contexts like market research, customer feedback analysis, or demographic studies, where highlighting differences in survey responses is essential.
Text Placeholders & Capacity
Keep your copy within these limits so it fits without resizing. Node body slots can hold around 20-25 words each.
| Placeholder | Count | Max characters (approx.) |
|---|---|---|
| Chart title | 1 | 25 |
| Item heading | 2 | 10 |
| Item body | 2 | 100 |
| Statistic value | 2 | 5 |
Slide Keywords
Download unlimited PowerPoint templates, charts and graphics for your presentations with our annual plan.
DOWNLOADReturn to Survey Presentation Template.