Strategic Planning Chart Concept for PowerPoint
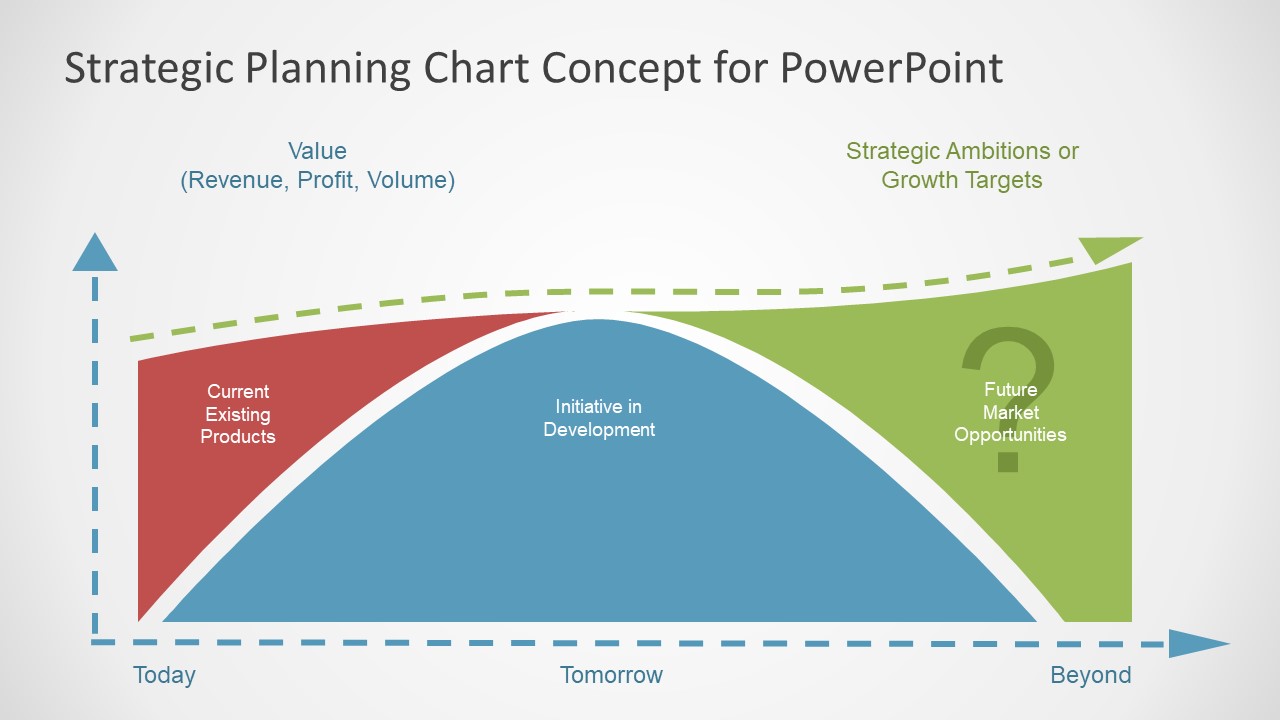
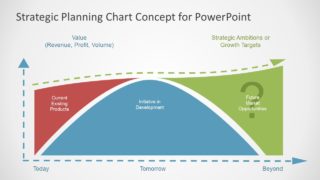
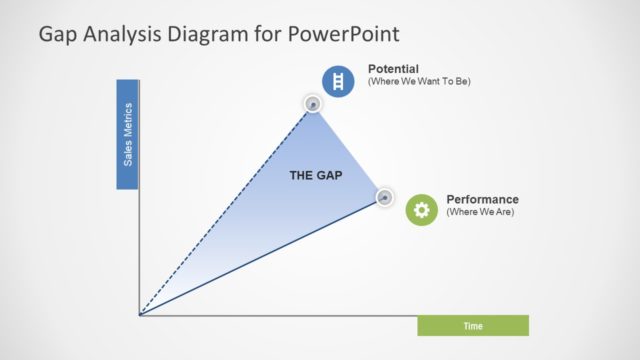
The Strategic Planning Chart Concept for PowerPoint is a visual presentation of innovation mapping graph. The businesses have a gap between company’s growth strategies and innovative product development. The lack of feasibility and risk analysis could affect business operation and product development. Therefore, strategic planning requires processes to address current and future growth of company. It could involve financial resources like revenue or profits, skilled workforce, management, and business model. The chart of strategic planning presents business value over time in terms of profit and growth. Although there are various analysis models to demonstrate growth concepts. This graph of strategic planning provides a quick view of revenue and profit growth.
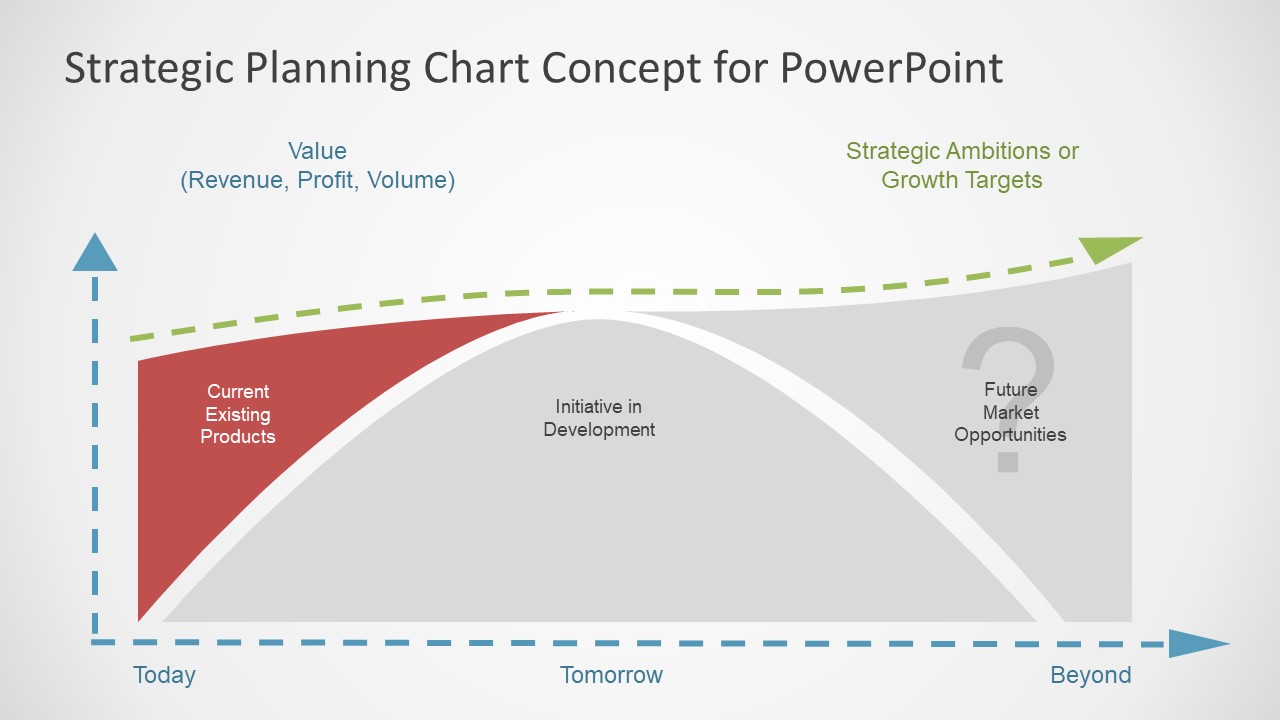
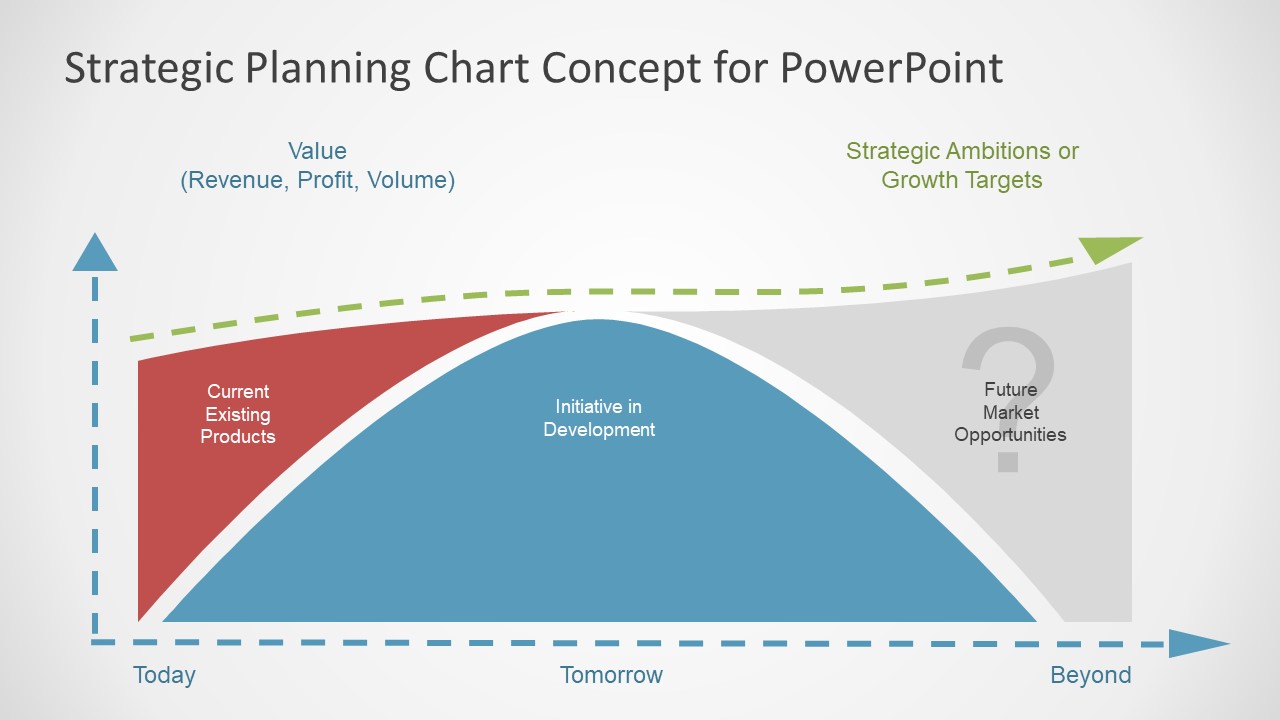
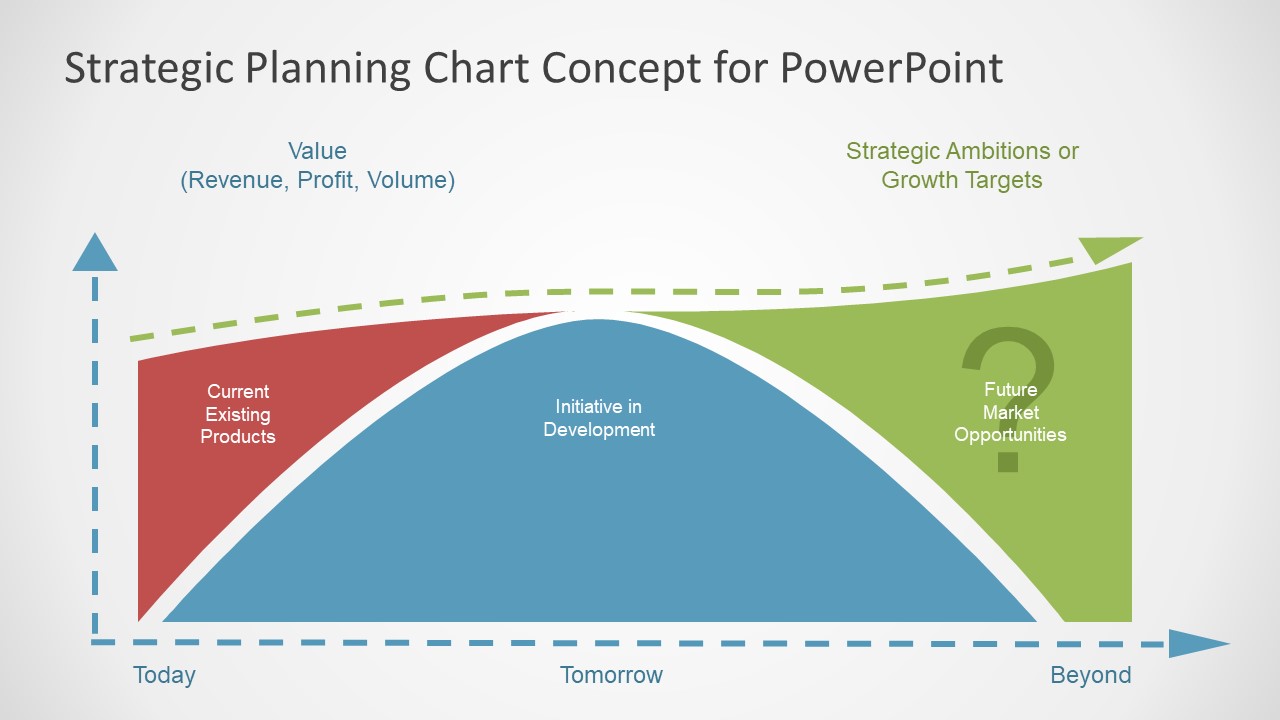
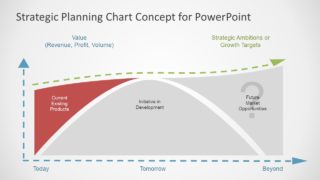
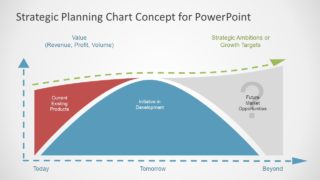
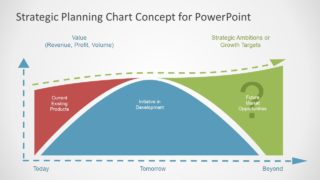
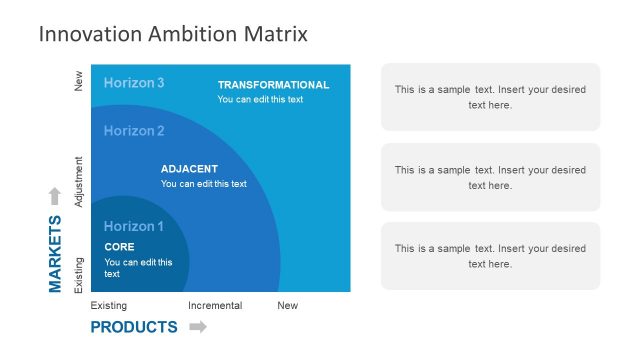
The PowerPoint chart of innovation strategic planning could help map-out growth in three segments. These include existing products/processes, development initiatives in the middle (near future), and future opportunities. Here, the growth of future market opportunities represents strategic ambitions or targets. This graph illustrates the value gap between existing products, development initiatives, and future market opportunities.
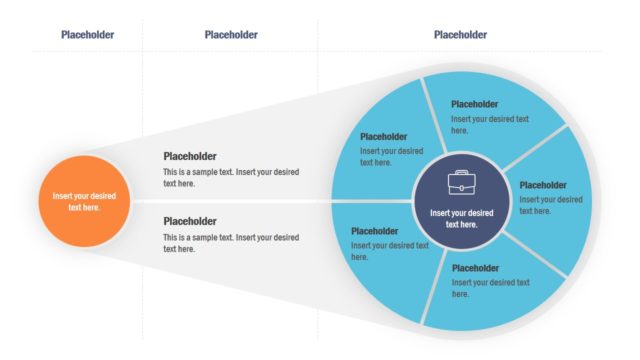
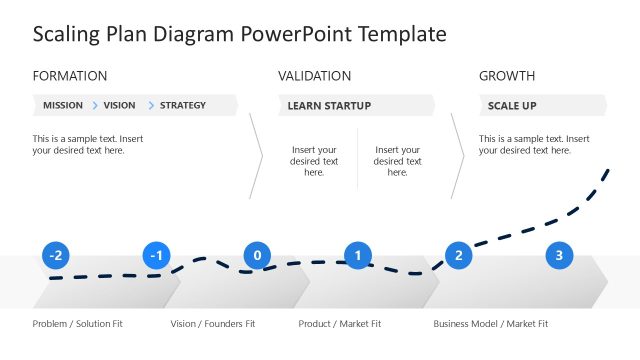
The Strategic Planning Chart Concept for PowerPoint includes 4 slides to focus on all three segments individually. All slides of PowerPoint chart template are fully editable layouts. Therefore, users can change colors or apply various other customizations to the template.
