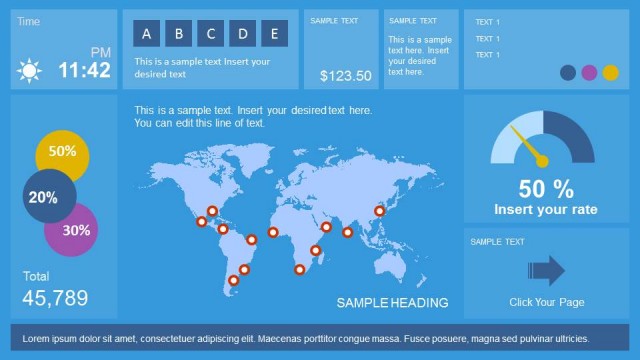
Smart City Monitoring Dashboard PowerPoint Template
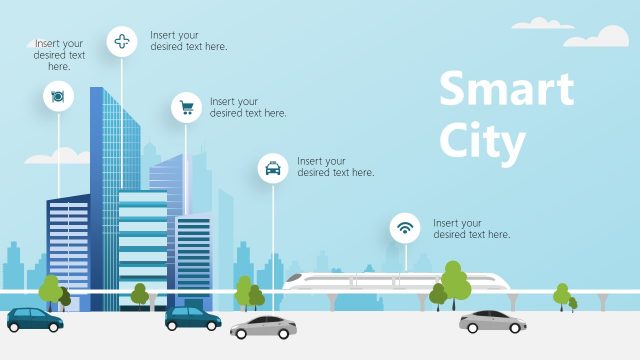
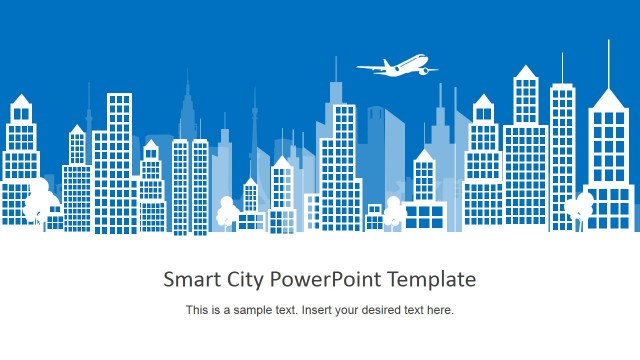
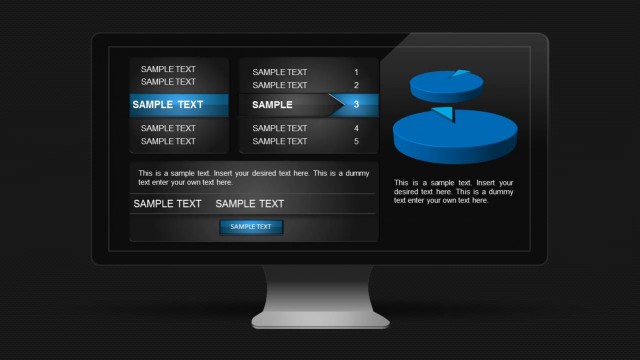
Smart City Monitoring Dashboard PowerPoint Template is a 1-slide presentation of city’s performance management system. It includes data charts, maps, and graphics for urban services data reports. A smart city is an urban area that uses technology to collect data to provide better services based on that data. The smart city dashboard template could used to present this data through graphs and charts. These charts will help describe yearly, monthly, and daily updates of the city’s performance for strategic monitoring. The strategy could be around institutional development, physical, social, and economic infrastructure.
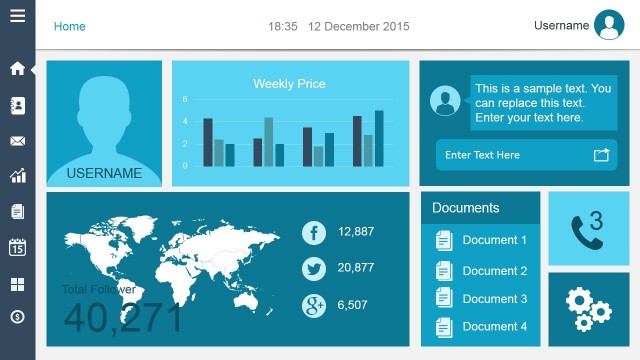
The smart city dashboard is also known as Mayor’s data dashboard help visualize performance of key services. The data collected from citizens and public is monitored and managed with the help of smart city applications. For example, managing mobility, energy efficiency, water supply, waste management, law enforcement, schools, hospitals, and other community services. The dashboard template of smart city monitoring is a design of key metrics to evaluate city’s performance data. The users can replicate smart city dashboard application data in PowerPoint for various presentations.
Smart city monitoring is the use of innovative AI-driven technology to manage urban services. A dashboard of smart city monitoring gives a holistic view of service KPIs in real-time. The stakeholders use smart city management systems to improve the efficiency and quality of community services. Intelligent city-systems use management dashboards that assist in providing a customized set of information. This information in the form of data charts helps to efficiently track and analyze key data points. Access to a smart city monitoring dashboard helps get all the necessary information about traffic, weather, air quality, etc. in one place.
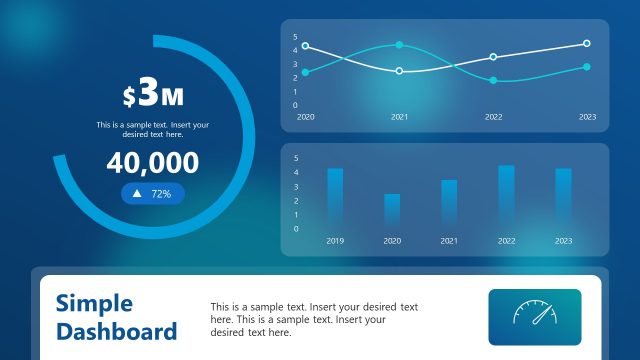
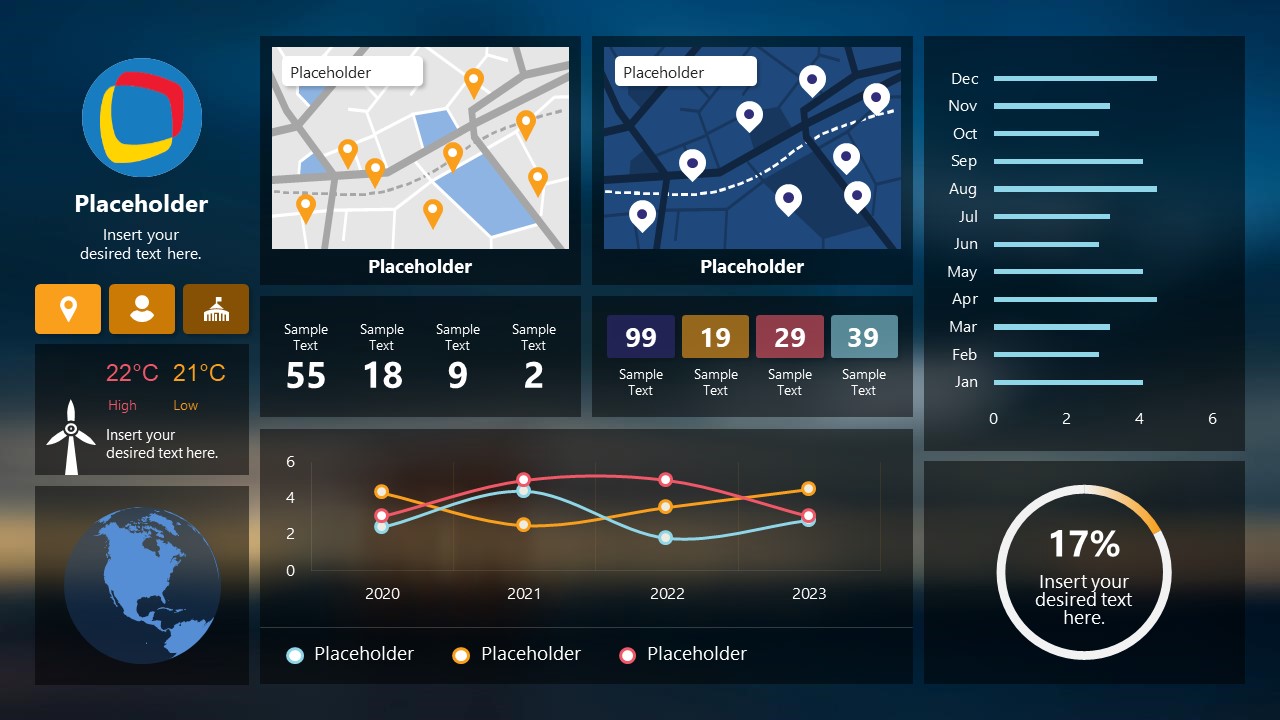
The Smart City Monitoring Dashboard PowerPoint Template contains two navigational maps for day and night view. The users can replace these maps and use location markers to highlight specific locations. It also contains custom data-driven charts for monthly and yearly performance reports. You can add your smart city application logo and data of city for performance meetings.
You must be logged in to download this file.
DOWNLOAD- Category
- Data & Charts
- Rating

 Loading...
- Size
- 16x9
- Item ID
- 20007-01
- Colors
Subscribe today and get immediate
access to download our PowerPoint templates.