Smart Analysis PowerPoint Template contains several slides for Microsoft PowerPoint that fit very well in business presentations or data analysis PowerPoint presentations. You can use smart analysis PowerPoint template to decorate your technology business presentations and present the outcome of a data analysis or a business process adoption.
What’s inside this template
Example presentation scenarios
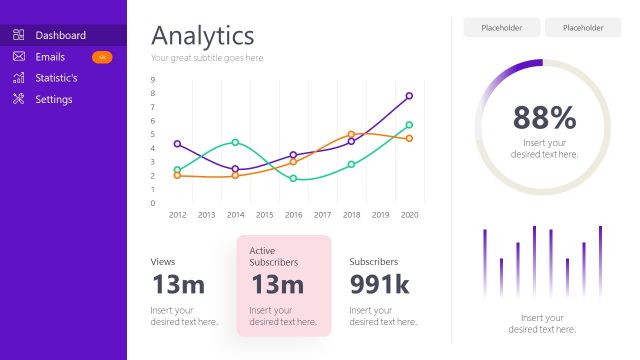
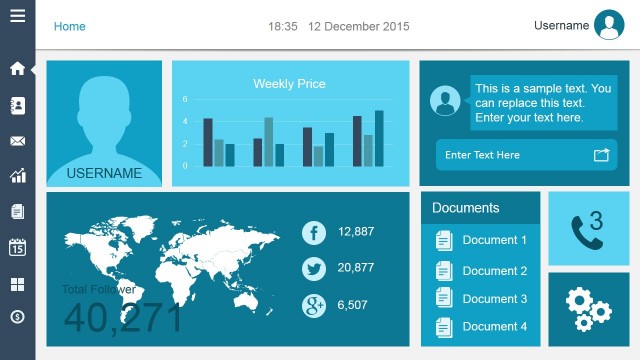
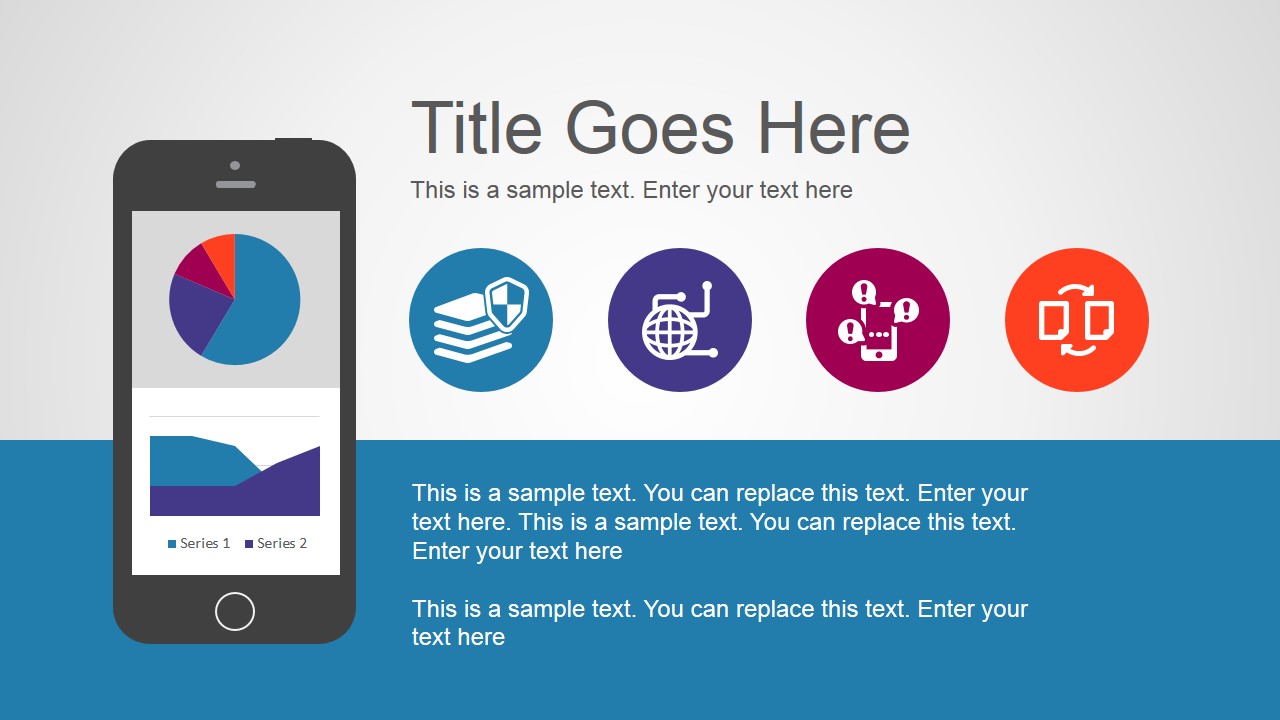
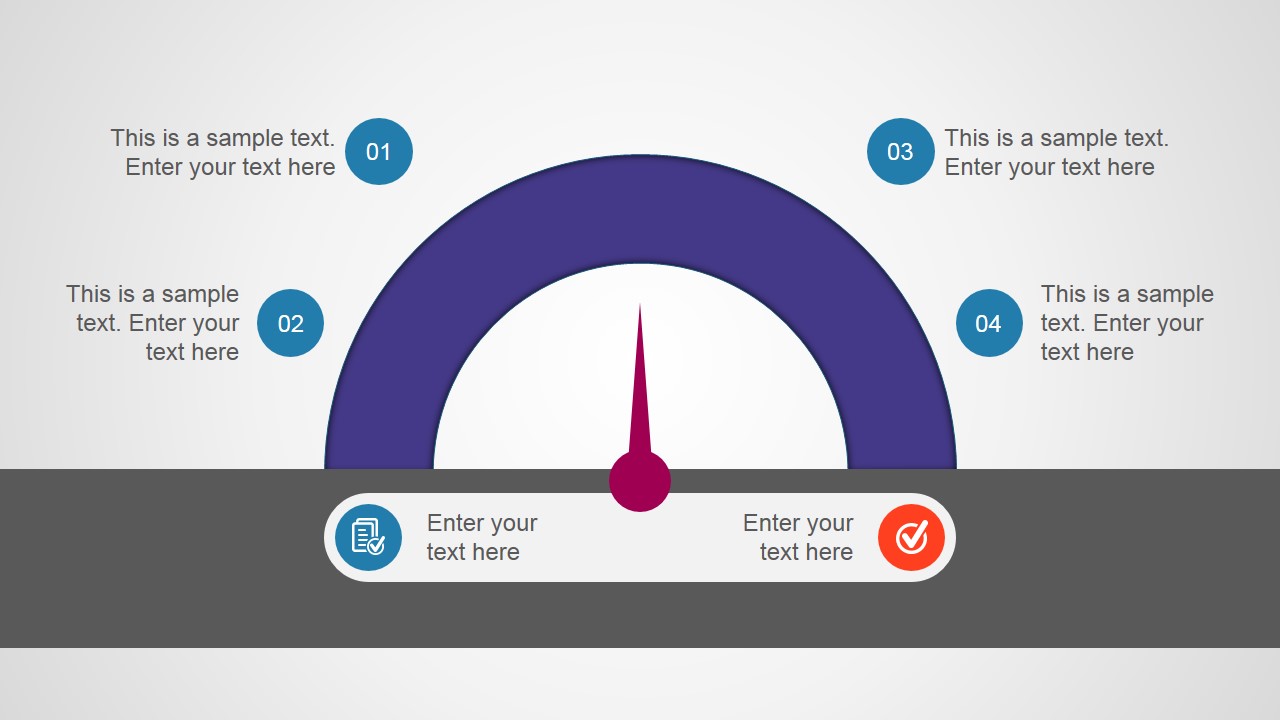
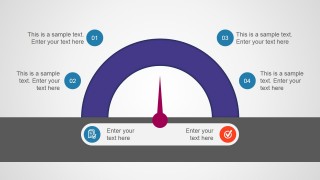
- A business analyst can present a KPI review by opening with the mobile dashboard cover and using the speedometer gauge to discuss performance status against a target.
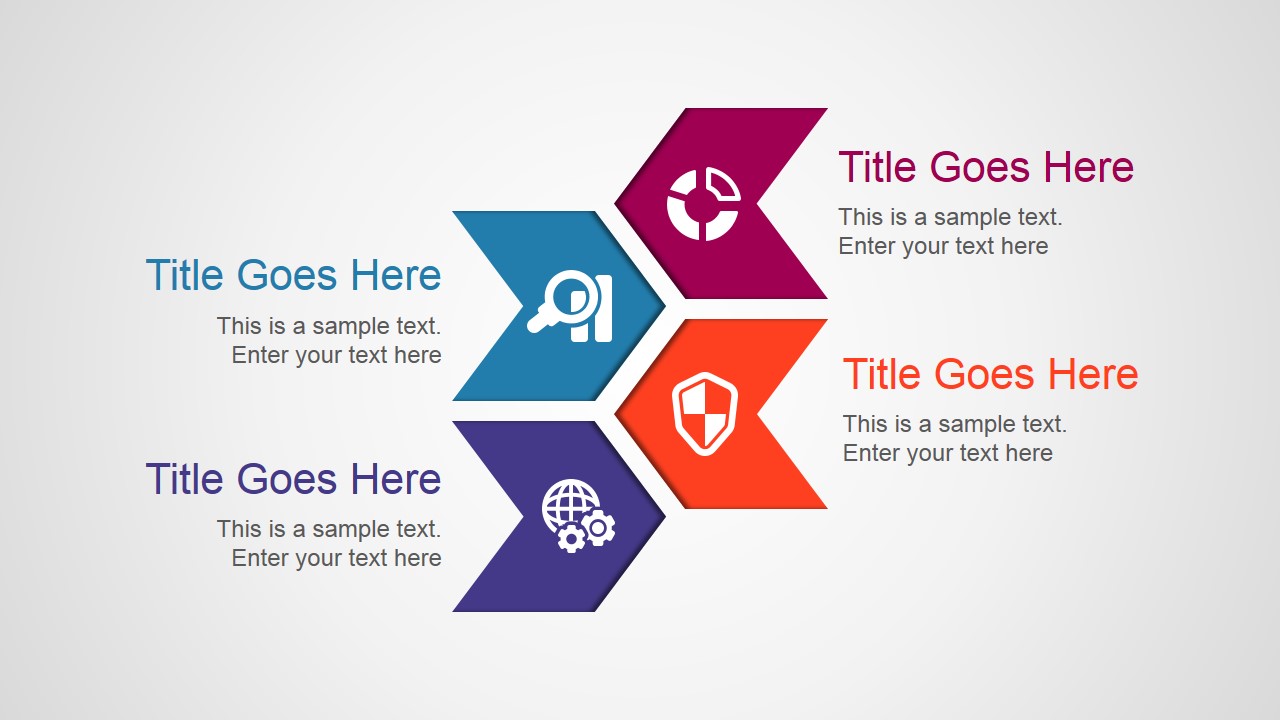
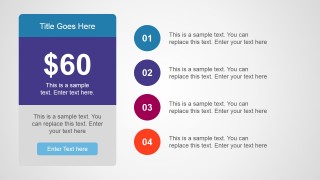
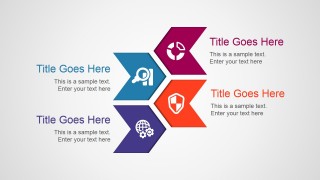
- A consultant can explain a transformation workstream by mapping the main activities into the four-step chevron process and supporting them with the numbered checklist slide.
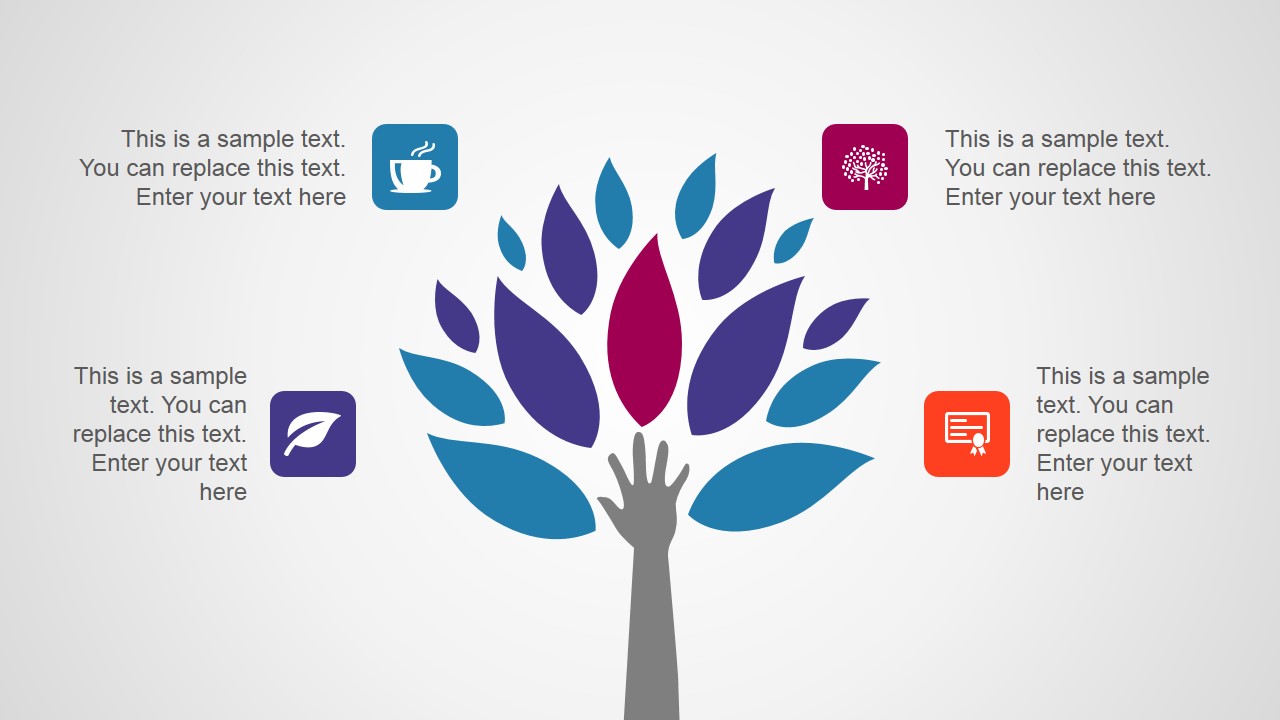
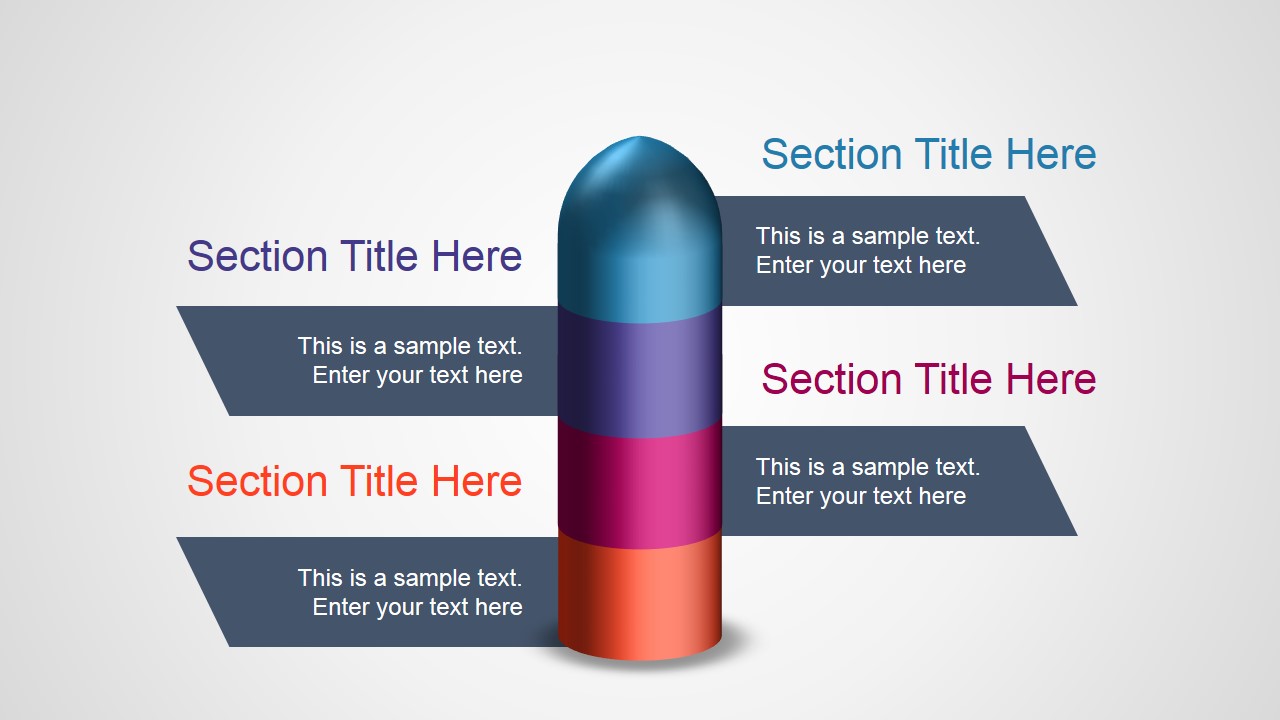
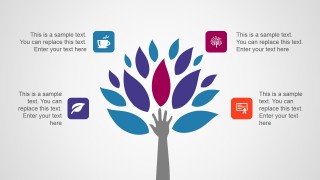
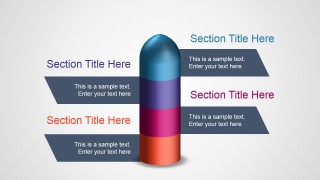
- A technology project manager can brief stakeholders on adoption priorities by using the smart tree diagram for capability themes and the rocket slide for launch phases.
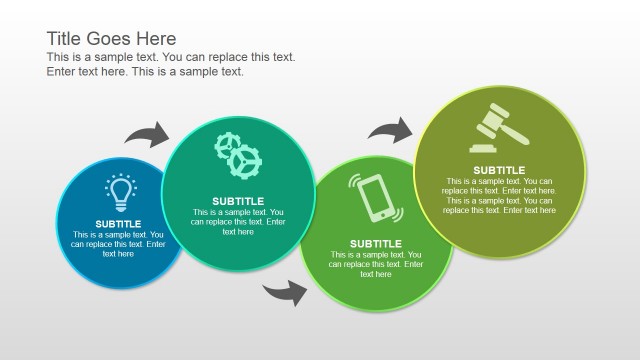
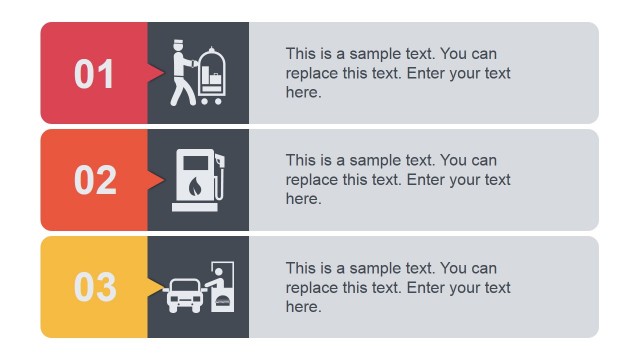
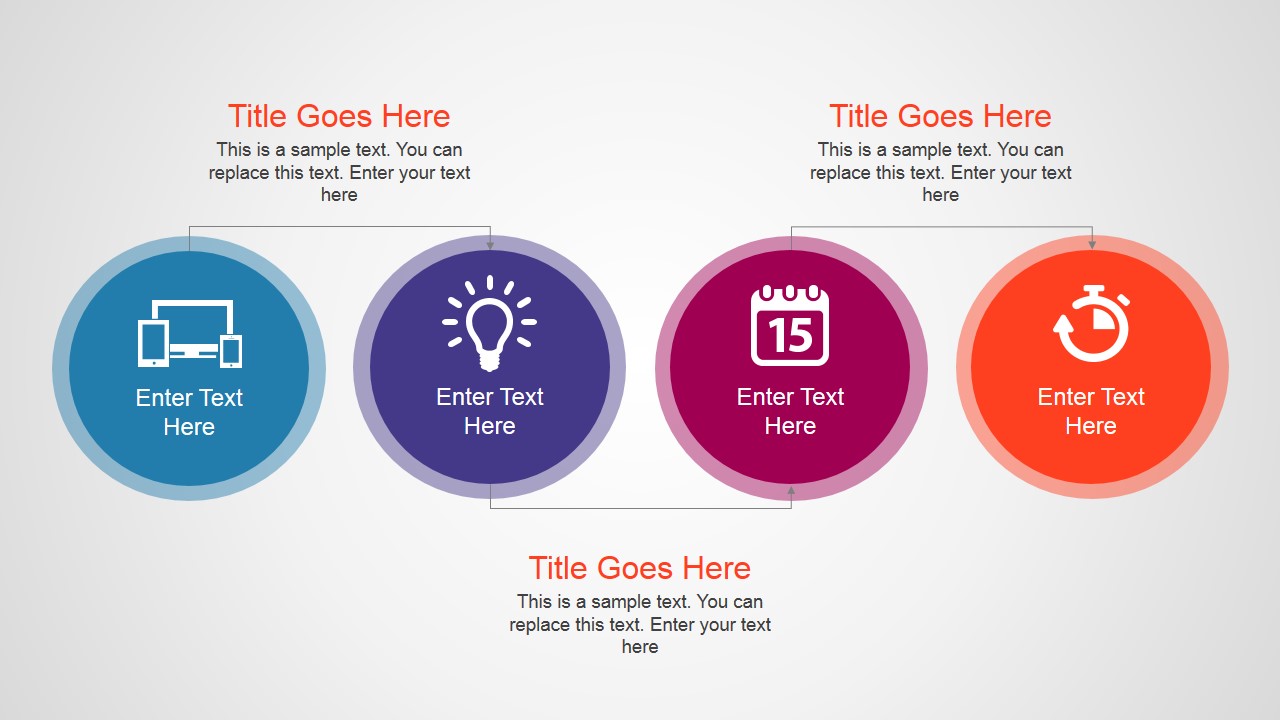
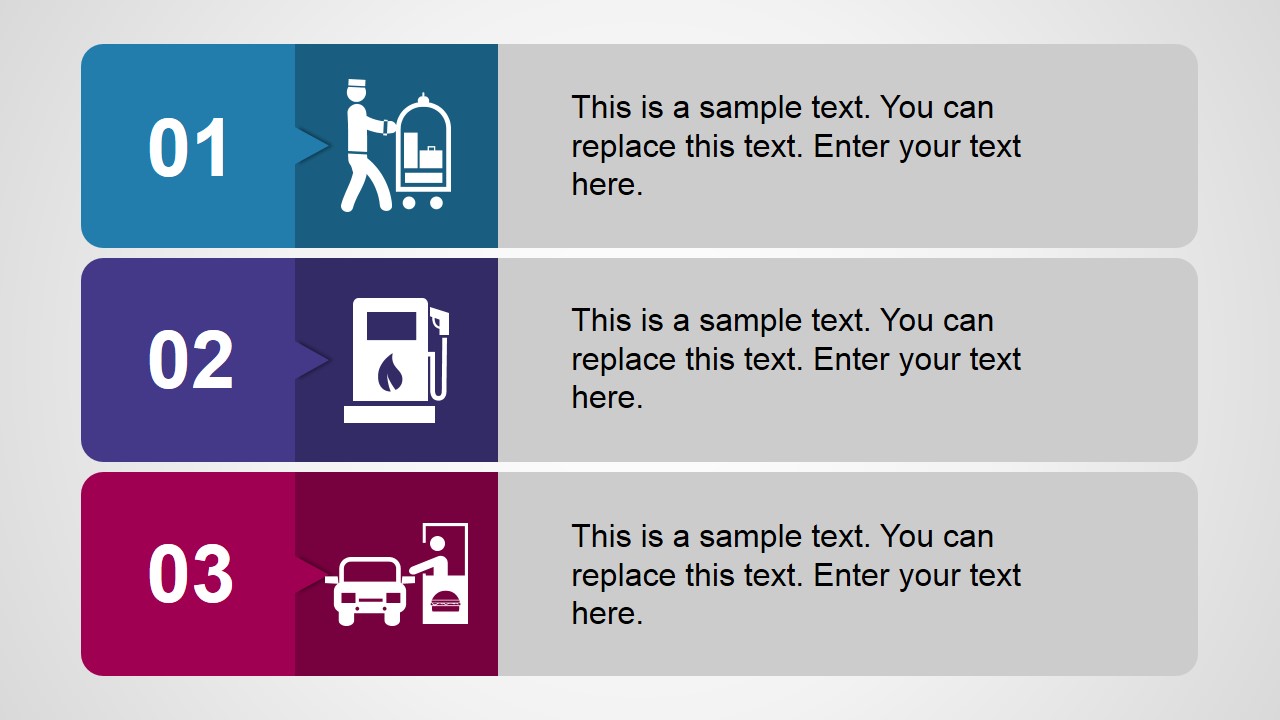
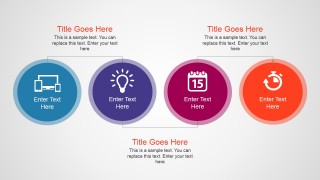
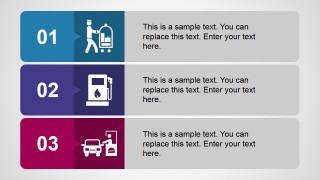
- A service manager can summarize operational issues by placing service categories in the three-row checklist and using the circular icon row to compare tools, ideas, schedules, and timing.
Features
- 100% editable presentation template
- Compatible with Microsoft PowerPoint and Google Slides
- 16:9 aspect ratio slides
- Scalable vector shapes, icons and illustrations
- AI-Ready for Microsoft Copilot and Claude
- Instant access and download
Frequently asked questions
Q: How should a presenter organize an analysis message with these slides?
A: Start with the mobile dashboard cover to define the subject and audience expectation. Use the smart tree or circular icon row to group the main themes, then move to the speedometer gauge for performance status. Close with the chevron process or numbered checklist so the audience leaves with clear next steps instead of only observations.
Q: Who is this template best suited for in a business setting?
A: This template fits analysts, consultants, service managers, and technology leads who need to explain findings without a dense data appendix. It works best for short briefings where the speaker must translate analysis into priorities, process steps, or implementation themes using the gauge, chevrons, rocket sections, and checklist panels.
Q: Why do the smart tree, speedometer, and rocket metaphors work for analysis topics?
A: The metaphors turn abstract analysis into familiar business signals. The tree suggests growth or capability branches, the speedometer communicates status at a glance, and the rocket implies launch momentum. These visuals reduce cognitive load because the audience can connect each topic to a simple meaning before reading the supporting text.

Smart Analysis PowerPoint Template
8-slide smart analysis presentation template with dashboard, gauge, and process infographic layouts
Smart Analysis PowerPoint Template is an 8-slide presentation template for analysts, consultants, and technology teams preparing business analysis reports. It includes a mobile dashboard cover, value card with numbered list, speedometer gauge, chevron process, rocket section diagram, circular icon row, and service checklist layouts for Microsoft PowerPoint and Google Slides.
- Category
- Template Backgrounds
- Rating


 Loading...
- Aspect ratio
- 16:9
- Item ID
- 4126-01
- Colors
 Microsoft PowerPoint
  Microsoft Copilot
  Claude for PowerPoint
 Other formats supported
Subscribe today and get immediate
access to download our PowerPoint templates.