Simple Dashboard PowerPoint Template
Our Simple Dashboard PowerPoint Template is an editable slide with data-driven charts for statistical presentations. The presentation of reports is an essential part of every business meeting. At the same time, it becomes hard to prepare a slide that is meaningful and engaging. We have created this PPT design with shadow effects to help prepare such professional presentations in just a few steps. Hence, users can create YTD (year to date), financial or revenue, or performance reports using this dashboard template. The slide is easy to edit with all versions of PowerPoint.
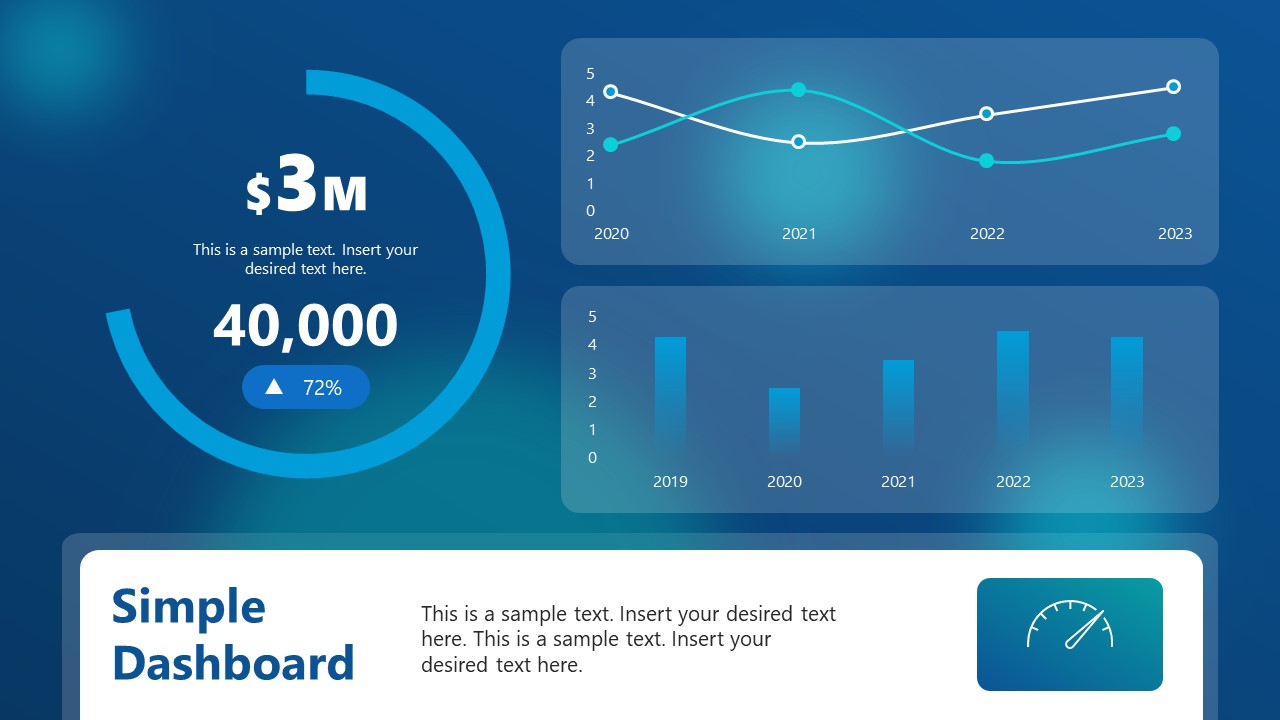
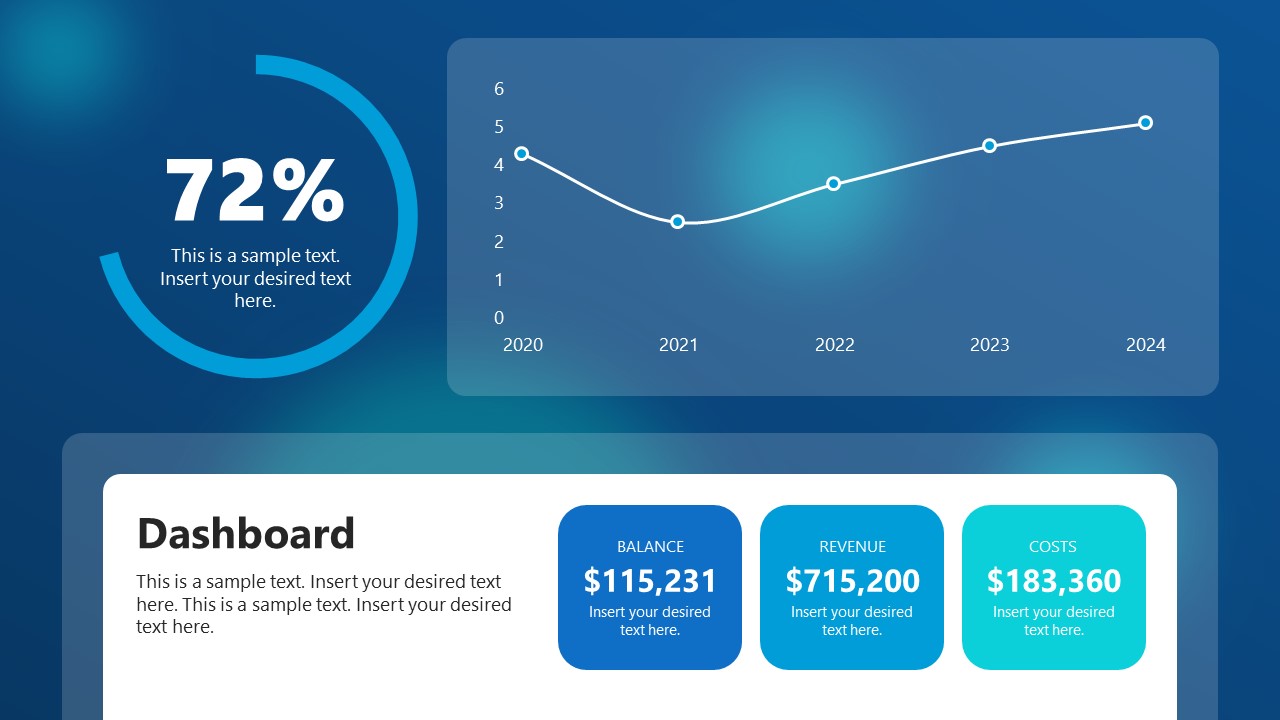
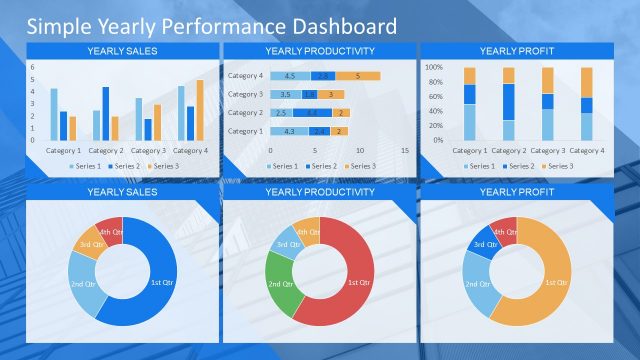
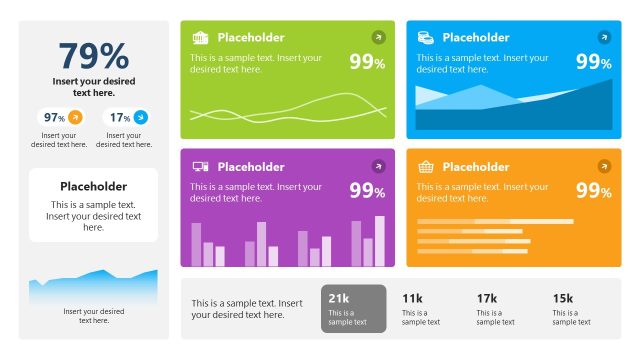
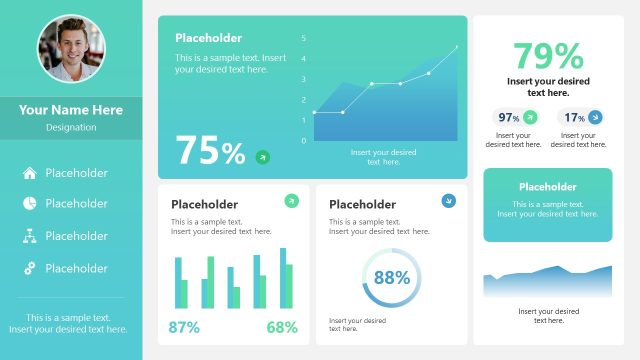
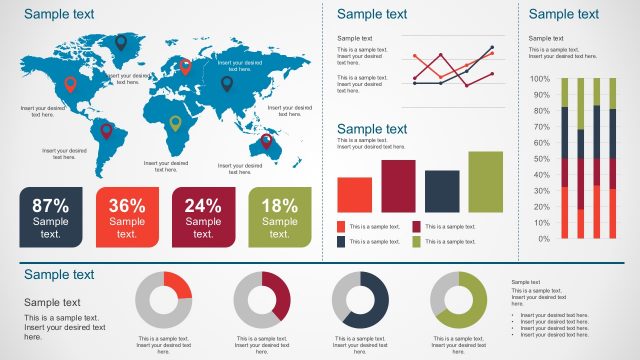
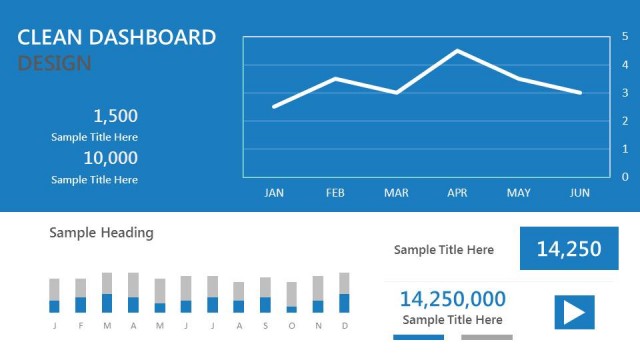
The first slide of the Simple Dashboard PowerPoint Template shows three sections: 1- an easy-to-edit line graph with an attached Excel sheet for managing data representation, 2- the bar graph with multiple values that can be customized as well, and 3- a circular diagram with text areas to show values like revenue growth, customer satisfaction rate (CSAT), etc. Using the white-colored section on the bottom of the slide, presenters can mention the titles, or short descriptions according to the requirements. The second slide carries a single-line graph segment that shows placeholder values. Unlike the first one, this slide has three segments in the bottom section to mention balance, revenue, and costs. However, users can alter these titles and values to present their analysis. A circular figure is placed on the top left to show the percentage of data values.
Professionals can prepare impressive presentations using this template slide’s simple structure and sections. Its applications are not limited to business or finance; users from all fields can incorporate their details for presentation. For instance, research scholars can showcase their research analysis with these editable graphs. Similarly, this simple dashboard PowerPoint template slide can help tech professionals to manage performances. So, grab this 100% editable slide template for your next business presentation!
