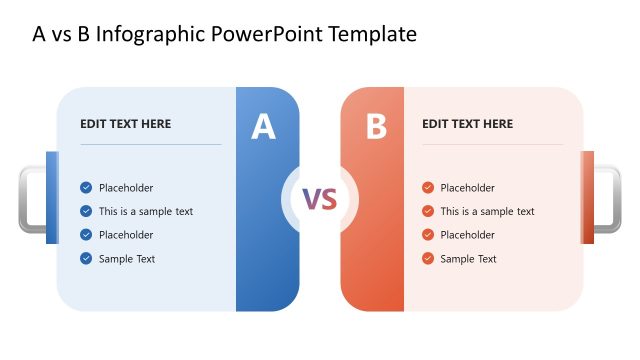
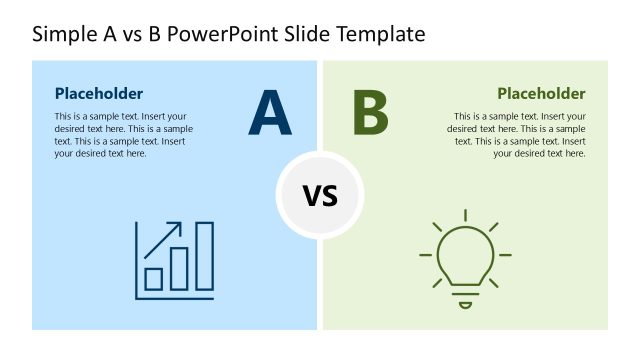
Slide 1 of 3 from Scale A vs B Comparison Infographic PowerPoint Template
Scale A vs B Comparison Infographic Presentation Template
A vs B Comparison Infographic Template
- Diagram
- Comparison Split
- Comparison Slide
- 16:9
- 100% Editable
The A vs B Comparison Diagram from the Scale A vs B Comparison Infographic PowerPoint Template provides a clear visual tool for contrasting two options side by side. This slide layout is designed for business presentations and pitch decks, featuring editable shapes and vector icons that facilitate detailed product comparisons and performance analysis. Suitable for decision-making scenarios, it enhances corporate presentations by visually balancing key points for each option within a professional slide deck.
What’s on This Slide
The layout features a central balance scale with two pans, one for Option A and one for Option B. Each pan contains a circular node labeled with the respective option letter. To the left of Option A, there are five text placeholders aligned vertically, while Option B has a similar arrangement on the right. Above each option is a rectangular label indicating 'Option A' and 'Option B,' respectively. A 'VS' label is positioned centrally below the scale. The background is light, enhancing the visibility of the elements.
How to Use It
This layout serves as a comparative analysis tool, ideal for evaluating two options side by side. It fits well in a presentation sequence after introducing a problem and before discussing solutions. It is useful in business scenarios such as product comparisons, performance evaluations, or decision-making processes where contrasting two alternatives is necessary.
Text Placeholders & Capacity
Keep your copy within these limits so it fits without resizing. Node body slots can accommodate about 30 characters each.
| Placeholder | Count | Max characters (approx.) |
|---|---|---|
| Item heading | 2 | 1 |
| Item body | 10 | 30 |
| Chart title | 1 | 40 |
| Footer | 1 | 60 |
Slide Keywords
Download unlimited PowerPoint templates, charts and graphics for your presentations with our annual plan.
DOWNLOADReturn to Scale A vs B Comparison Infographic PowerPoint Template.