Slide 3 of 3 from Scale A vs B Comparison Infographic PowerPoint Template
Scale A vs B Comparison Infographic PowerPoint Slide
A vs B Comparison Scale Infographic Slide
- Diagram
- Comparison Split
- Comparison Slide
- 16:9
- 100% Editable
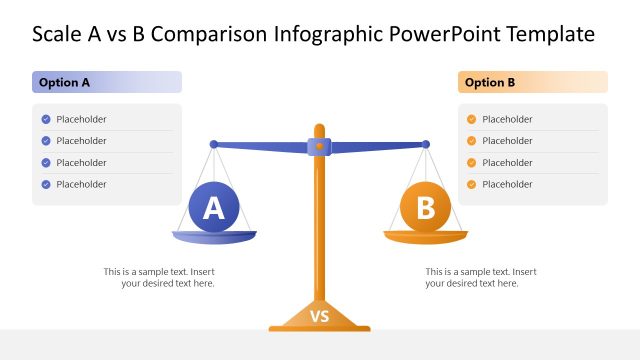
The A vs B Comparison Scale slide from the Scale A vs B Comparison Infographic PowerPoint Template offers a clear visual tool for business presentations. This slide template uses a balanced scale diagram to compare two options side by side, making it suitable for product comparison, performance evaluation, and strategic decision-making. It integrates editable shapes and text placeholders to customize criteria and descriptions, enhancing corporate presentations and pitch decks with professional slide templates.
What’s on This Slide
The slide features a balance scale positioned centrally, with two circular plates labeled A and B. Option A is represented by a blue plate on the left, while Option B is an orange plate on the right. Each plate has a text placeholder below for descriptions. Above the scale, there is a header for 'Option B' aligned to the right, with a corresponding text placeholder for criteria. The background is white, providing contrast to the colorful elements. The visual hierarchy emphasizes the scale as the focal point, with clear separation between the two options.
How to Use It
This layout serves as a comparison tool, ideal for evaluating two distinct options side by side. It fits well in a presentation sequence where decision-making is discussed, particularly after outlining criteria or pros and cons. This structure is beneficial for business scenarios like product comparisons, performance evaluations, or strategic choices, allowing stakeholders to visualize differences effectively.
Text Placeholders & Capacity
Keep your copy within these limits so it fits without resizing. Body slots can accommodate roughly 10-15 words each.
| Placeholder | Count | Max characters (approx.) |
|---|---|---|
| Slide title | 1 | 40 |
| Item heading | 2 | 10 |
| Item body | 2 | 50 |
| Callout | 1 | 30 |
Slide Keywords
Download unlimited PowerPoint templates, charts and graphics for your presentations with our annual plan.
DOWNLOADReturn to Scale A vs B Comparison Infographic PowerPoint Template.