Slide 19 of 20 from Professional Company Profile PowerPoint Template
Company Profile PowerPoint Financial Infographics
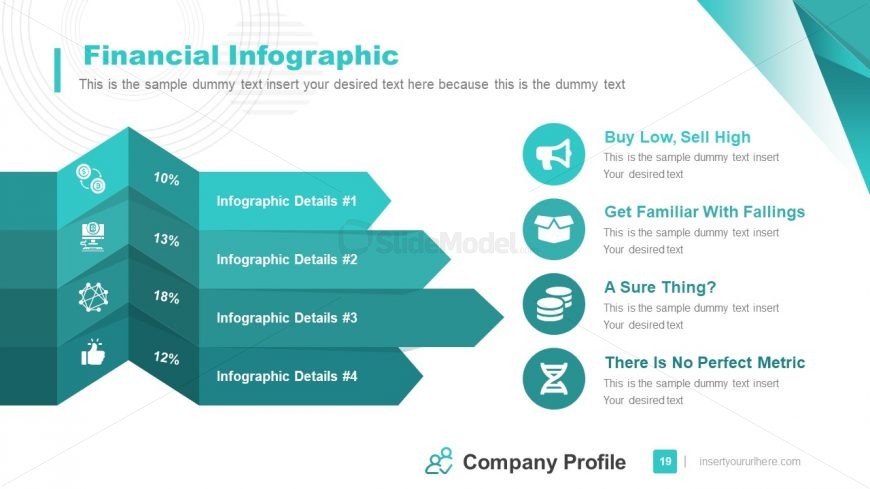
Layered financial infographic with four metrics
- Diagram
- Layered Stack
- Statistics Slide
- 16:9
- 100% Editable
What’s on This Slide
Top-left shows a prominent title with a single-line subtitle aligned left. The left-center has a vertical stack of four three-dimensional, right-pointing chevrons in graduated teal tones; each chevron holds a short face label, a small white icon near the left edge, and a percentage value toward the center. The right half presents a vertical column of four circular icon badges with bold headings and one-line descriptive text to each heading's right. A centered footer displays the company name and a small page number at the bottom. Background is white with teal corner accents.
How to Use It
This layout functions as a four-row layered infographic that pairs proportional percentages with explanatory callouts. Use it to present ranked financial metrics, cost component breakdowns, KPI drivers, or prioritized improvement opportunities. It works best late in a presentation after detailed tables or charts to summarize key figures or highlight top contributors. The left chevrons communicate magnitude and ordering while the right icon column links each metric to an implication or recommendation. Replace icons and short labels to match content; avoid dense numeric tables because the layout favors concise percentages and single-sentence explanations.
Text Placeholders & Capacity
Keep your copy within these limits so it fits without resizing. Left chevron faces fit short phrases; right callouts support single short sentences of roughly 60 to 80 characters.
| Placeholder | Count | Max characters (approx.) |
|---|---|---|
| Slide title | 1 | 30 |
| Subtitle | 1 | 120 |
| Item heading | 4 | 28 |
| Data label | 4 | 4 |
| Stage label | 4 | 40 |
| Item body | 4 | 80 |
| Footer | 1 | 40 |
| Section number | 1 | 3 |
Slide Keywords
Download unlimited PowerPoint templates, charts and graphics for your presentations with our annual plan.
DOWNLOAD