Slide 13 of 18 from Investors Relations Overview PowerPoint Template
85349-01-investors-relations-overview-powerpoint-template-16×9-13
Financial Overview Slide for Investor Relations
- Chart
- Bar Vertical
- Financial Summary Slide
- 16:9
- 100% Editable
The Financial Overview Slide from the Investors Relations Overview PowerPoint Template offers a clear layout for presenting key financial metrics and comparative data. Ideal for business presentations and investment pitches, this slide uses editable shapes and vector icons to highlight performance indicators and growth trends effectively within a corporate presentation or pitch deck template.
What’s on This Slide
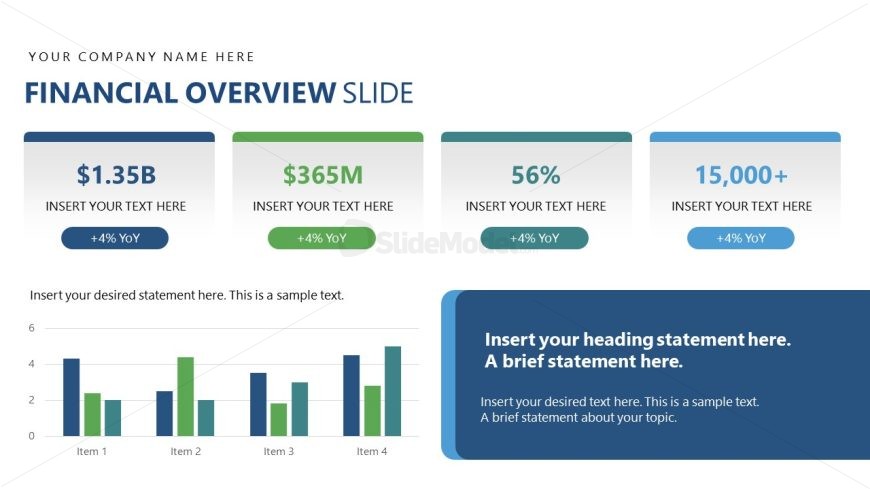
The layout features a top section with a bold title, 'FINANCIAL OVERVIEW SLIDE,' centered at the top. Below, there are four rectangular boxes aligned horizontally, each containing a financial metric, such as '$1.35B' and '56%.' Each box has a placeholder for additional text and a '+4% YoY' indicator. The bottom section includes a bar chart with four bars, labeled 'Item 1' to 'Item 4,' showing comparative data. There are text placeholders below the chart for a statement and a heading, with the overall color scheme being blue and green.
How to Use It
This layout serves as a financial summary, presenting key metrics and a comparative analysis. It fits well in a presentation sequence after discussing market opportunities or business models. This slide is useful for investors to quickly grasp financial performance and growth indicators. It can be applied in quarterly reviews, fundraising pitches, or annual reports to showcase financial health and projections.
Text Placeholders & Capacity
Keep your copy within these limits so it fits without resizing. Body slots can hold around 20 words each.
| Placeholder | Count | Max characters (approx.) |
|---|---|---|
| Slide title | 1 | 25 |
| Item heading | 4 | 10 |
| Item body | 4 | 20 |
| Body paragraph | 1 | 150 |
| Callout | 4 | 10 |
Slide Keywords
Download unlimited PowerPoint templates, charts and graphics for your presentations with our annual plan.
DOWNLOAD