Procurement PowerPoint Dashboard
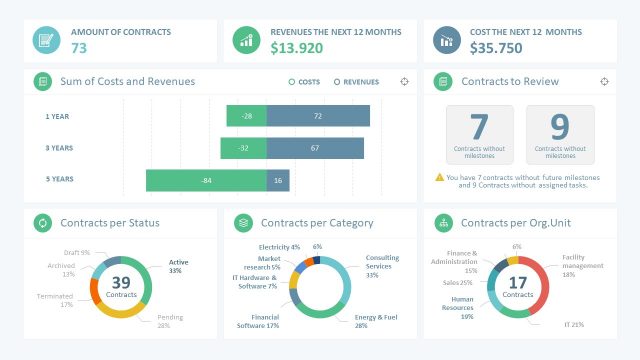
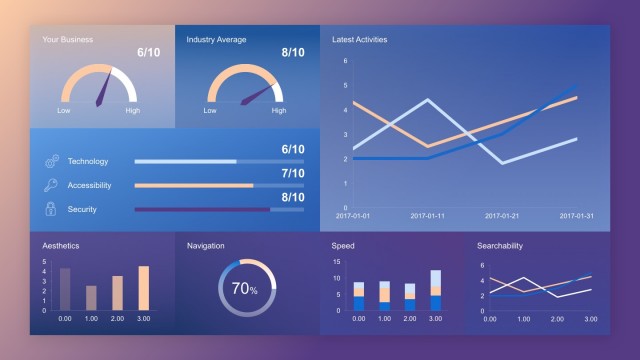
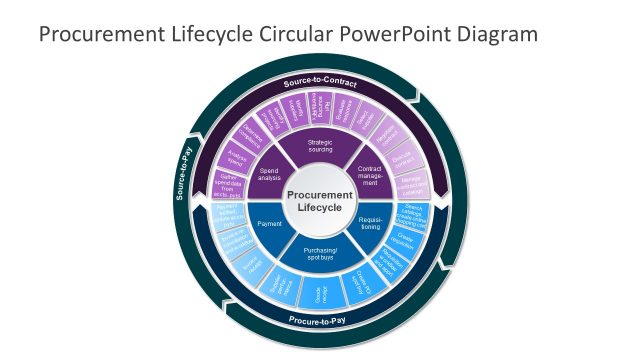
The Procurement PowerPoint Dashboard presents a collection of data-driven charts and graphics aimed at procurement management. The procurement process involves obtaining goods or services for business purposes. When a company needs products or services at large scale, the act of purchasing includes procurement processes. It is critically important for businesses to make purchasing decisions. The data dashboards for procurement enable professionals to evaluate and optimize companies’ purchasing processes. Purchasers and suppliers are both a part of this to ensure products are available and without defects. These processes may include procurement KPIs such as purchase order cycle time, defect rates, compliance rate, costing, etc. The PowerPoint templates of Procurement dashboard include data & charts as a statistical summary, making comparisons easier.
The procurement department is a business unit to link needs of company to suppliers or contractors. Procurement dashboards are powerful tools to help companies thrive in a competitive economy. SlideModel dashboards for procurement are designed for three major processes involved in procurement reporting. These are; supplier delivery, Procurement cost and ROI, quality and compliance. The dashboard slides will provide a complete picture of analysis with all facts and figures. This presentation will help you save time and focus on important data during decision making.
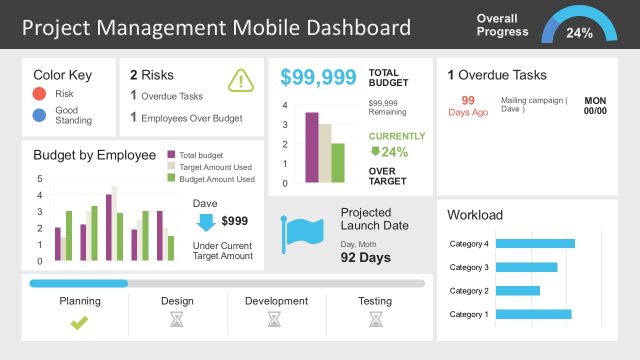
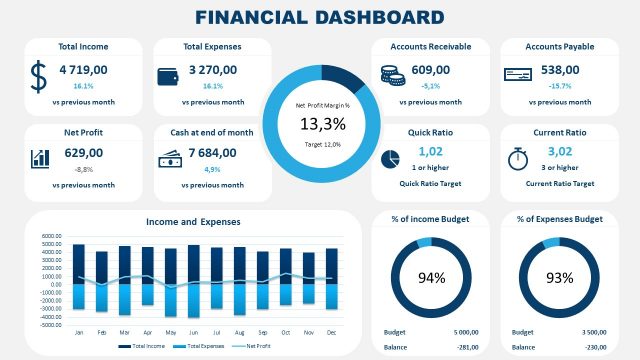
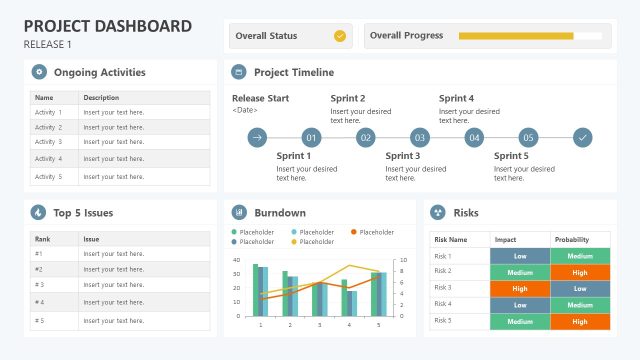
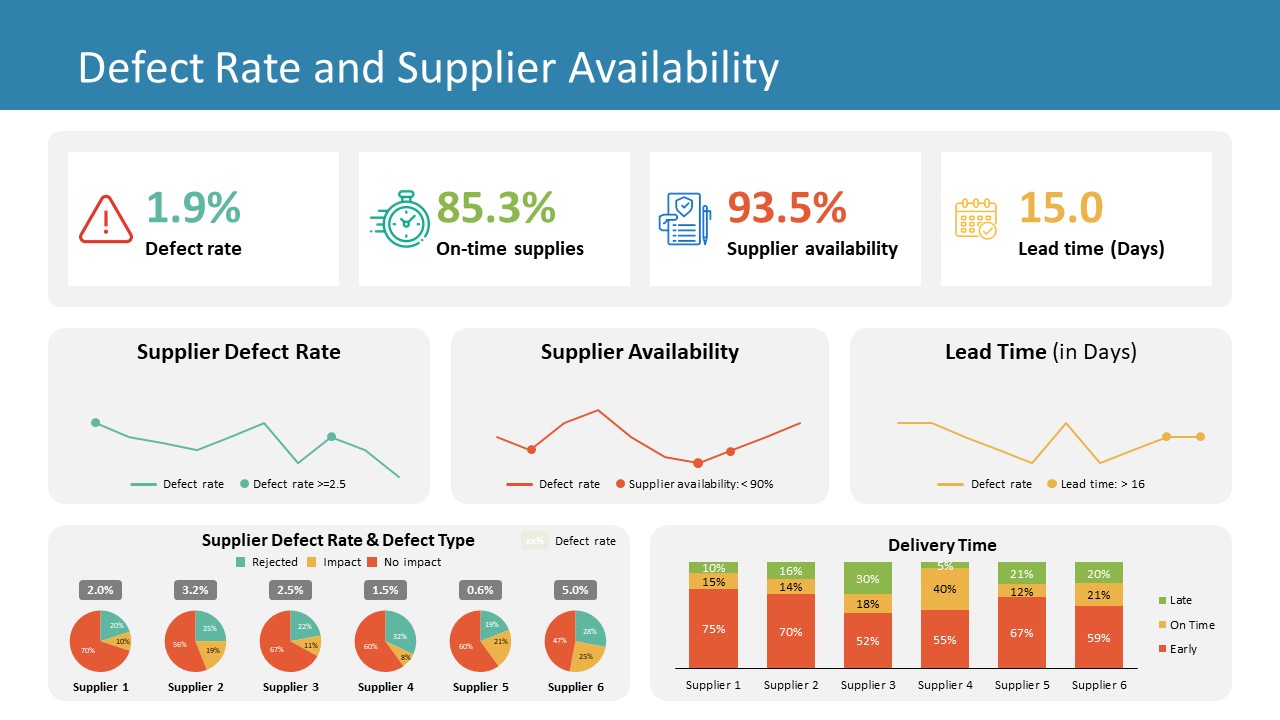
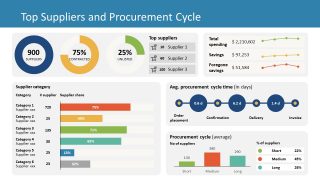
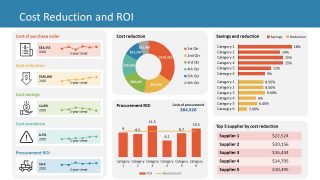
The Procurement PowerPoint Dashboard templates are a set of data-driven charts. The users can easily customize these charts using company’s data to shortlist or finalize suitable suppliers. The first slide gives an overview of various metrics that procurement department works with. For example, the supplier’s category and procurement cycle. The cost reduction and ROI dashboard template bring attention to the financial aspects i.e. optimizing cost. It provides figures for cost reduction parameters, savings, and order of suppliers in terms of cost reduction. Finally, the defect rate and supplier availability focus on the right sources at the right time.
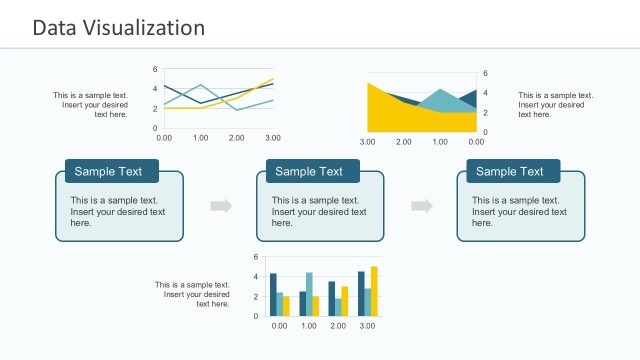
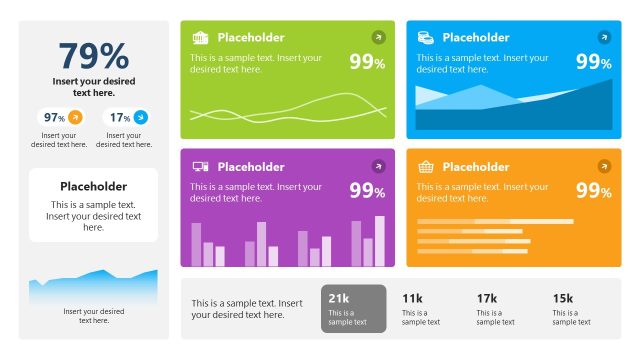
The dashboard PowerPoint templates for businesses are useful reporting tools for data analysis. The data charts visualize KPIs and highlight key components. This presentation will assists businesses to make informed decisions in financial and operational activities.


You must be logged in to download this file.
DOWNLOAD- Category
- Data & Charts
- Rating


 Loading...
- Size
- 16x9
- Item ID
- 13194-02
- Colors
Subscribe today and get immediate
access to download our PowerPoint templates.