Sales Manager PowerPoint Dashboard
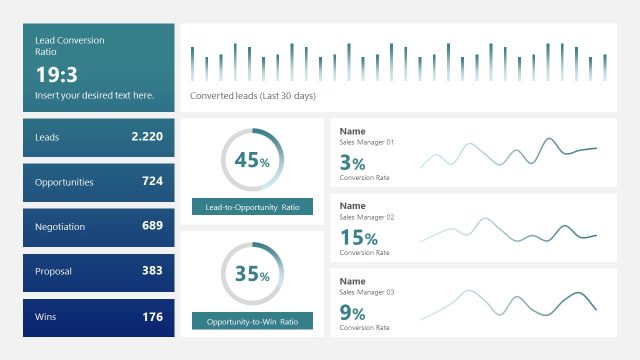
The Sales Manager PowerPoint Dashboard is a data driven PowerPoint template comprise of progress reporting diagrams. A Dashboard is a visual display of the most critical interrelated indicators to achieve versus one or more goals; which fits completely in a single view screen to understand the complexity. The PowerPoint Slide aids in demonstration of these innovative and useful panels including sales KPI (key performance indicator) reporting and status with the help of charts and visual diagrams. This reporting tool transforms data into acumen. The sales dashboards give real time visibility to forecast where fast planning and decision making is involved.
The businesses have adopted KPI’s dashboards as a tool for effective and efficient reporting . In today’s competitive market place, managers are required to analyze sales matrices, performances, product without going through pile of paperwork. Many project management and enterprise solutions have shifted their research to visually interactive dashboard reporting system which streamlines data. This tool helps managers to overview operations or dig deeper into one sale process. However, the sales dashboard assists in overall sales reporting and multiple departmental statistics in a fraction of time. It also helps motivate staff, gives them a competitive boost and opens opportunities.
The primary features of Sales KPI Dashboards are as follow:
- Track sales
- Identify problematic areas – weak links
- Geographical statics of sales
- Filters and data sorting options
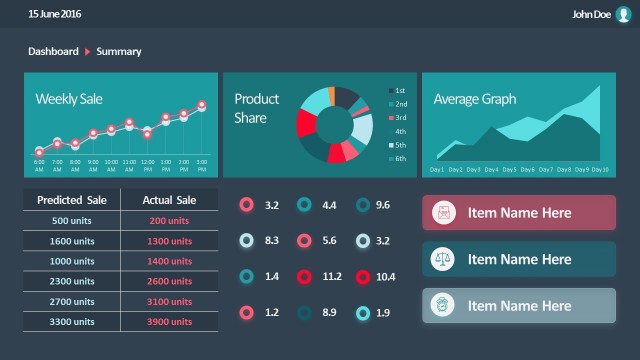
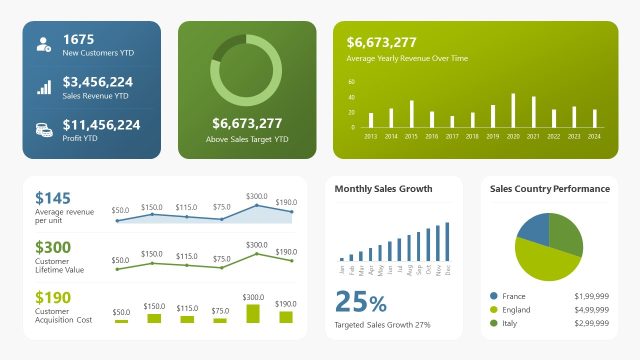
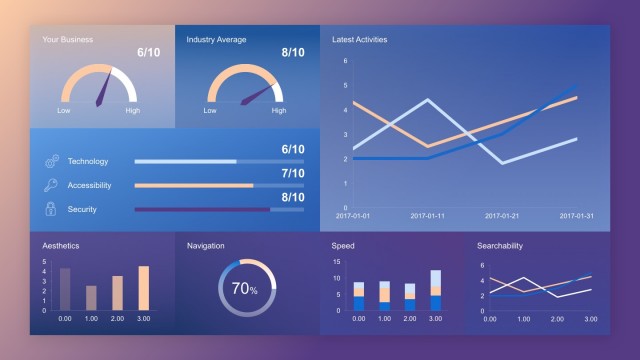
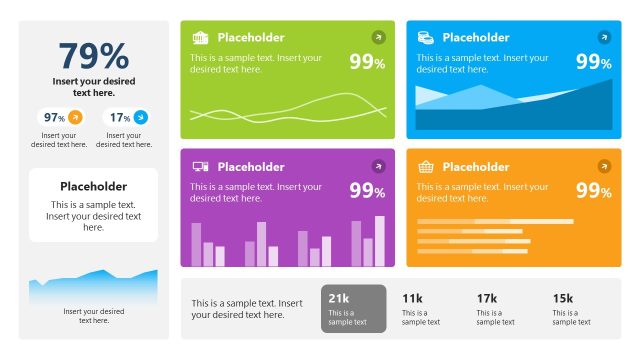
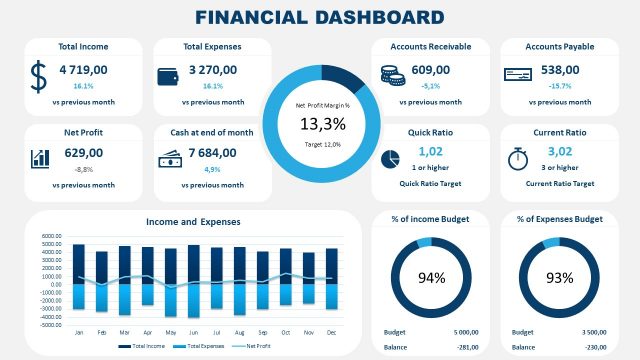
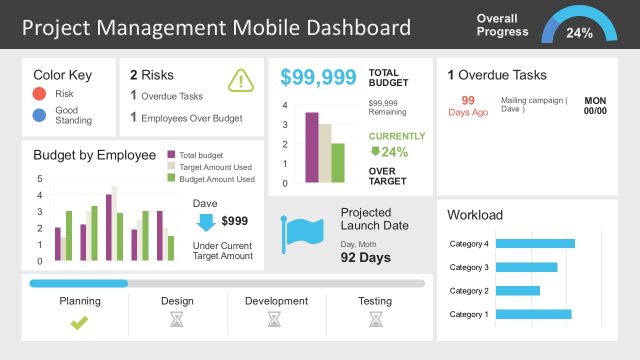
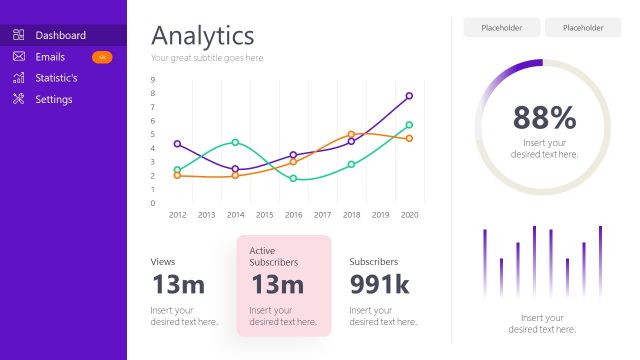
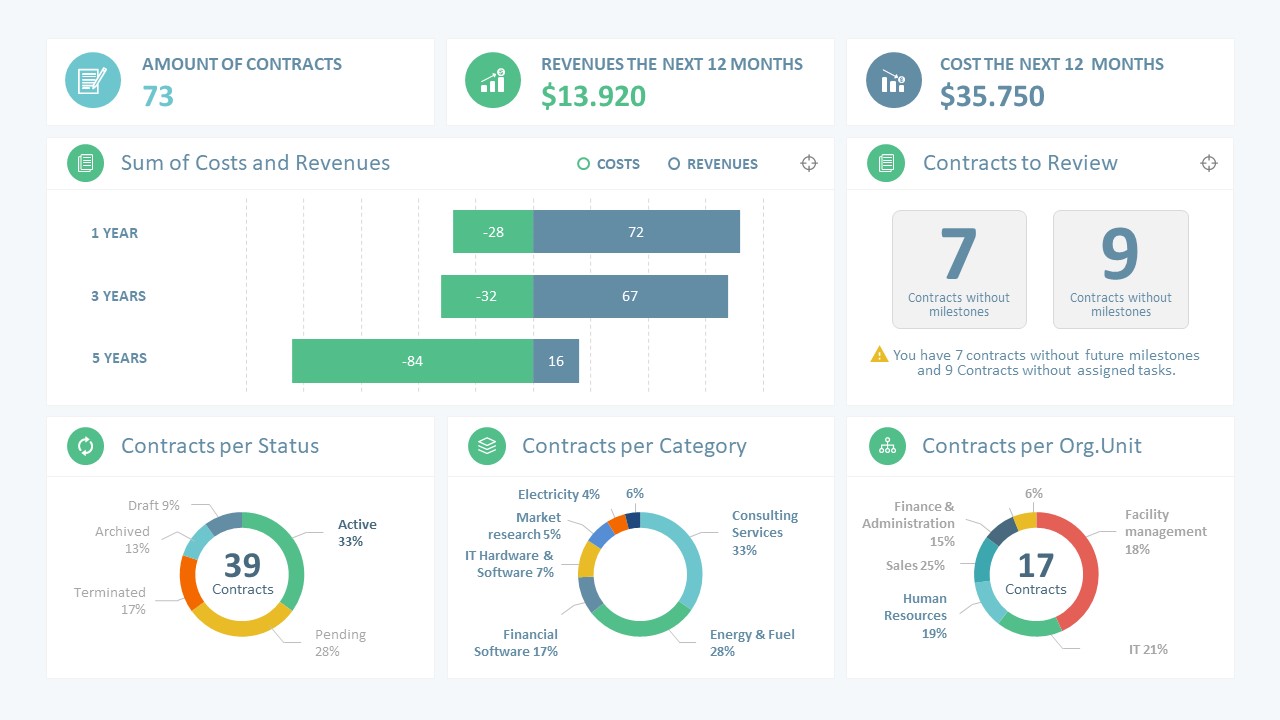
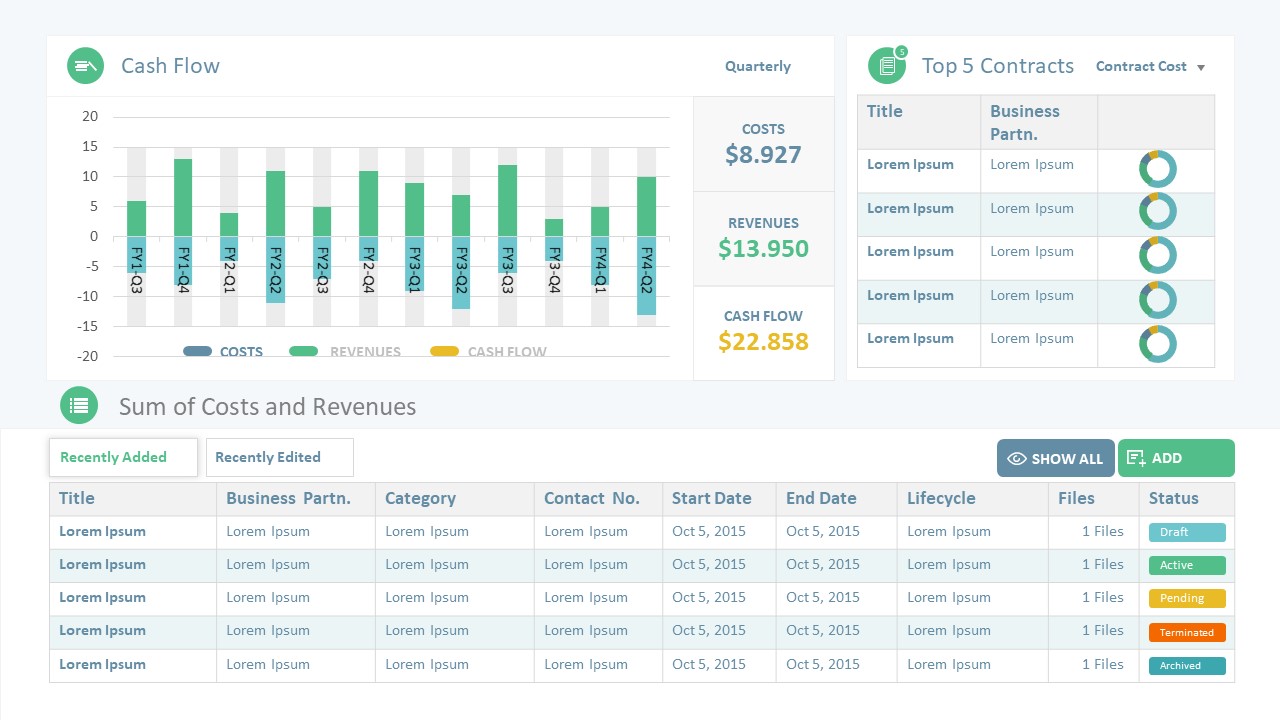
The Sales Manager PowerPoint Dashboard is a data driven diagram template where users can drive data values from excel. Good visuals are important, this presentation includes PowerPoint charts such as box & whisker for revenue, doughnut for multiple status reports, bar chart to display cashflow. All of them arranged in a professional looking layout. The template also gives dashboard options like executive summary, contrasts, prospects/leads, details of cost and revenue. The multi-optional business dashboard PowerPoint also has a collection of useful infographics for sales management presentation needs. The users can create more slides by copying these infographic icons and data-driven charts and represent more data values.
With the help of Sales Manager PowerPoint Dashboard, users can present various aspects of sales process and allow audience to plan best opportunities with forecasting tools and monitor current sales status. It is a useful presentation template for business and marketing professionals at managerial level to showcase sales data in meeting with board members.
You can include additional Dashboard Slides to your presentation through our Dashboard Templates gallery.


You must be logged in to download this file.
DOWNLOAD- Category
- Data & Charts
- Rating


 Loading...
- Size
- 16x9
- Item ID
- 7464-01
- Colors
Subscribe today and get immediate
access to download our PowerPoint templates.