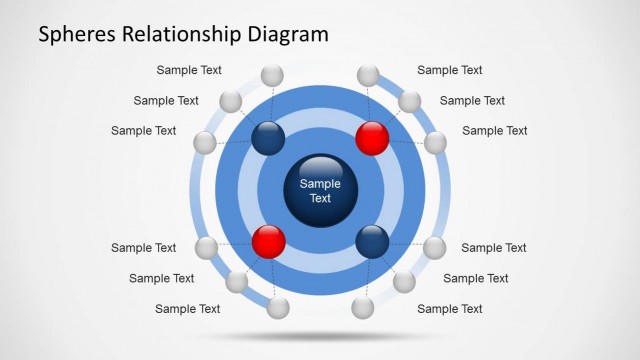
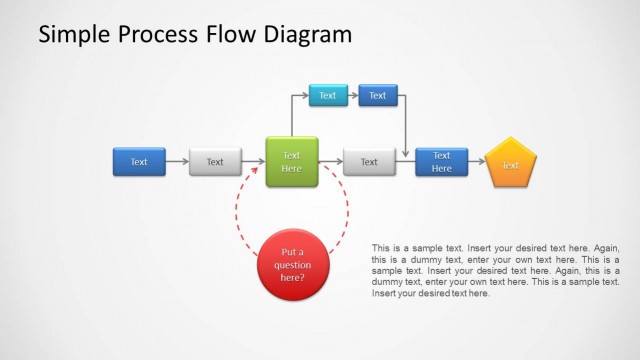
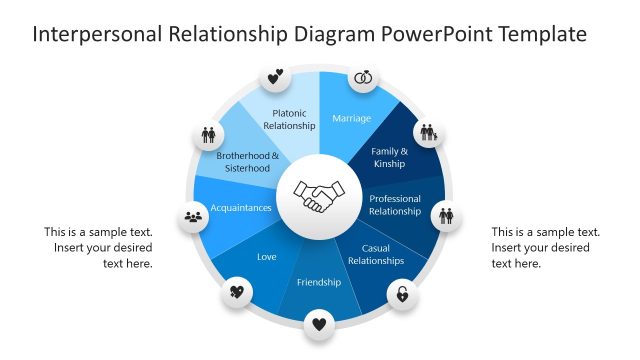
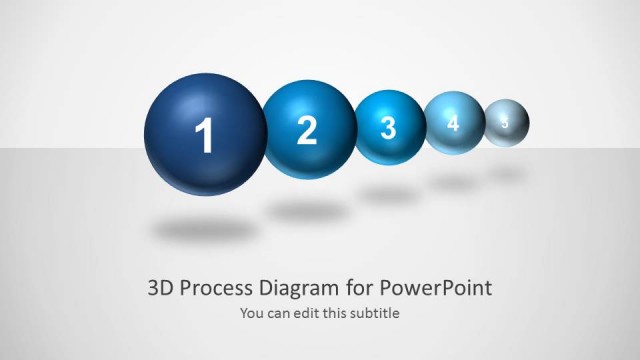
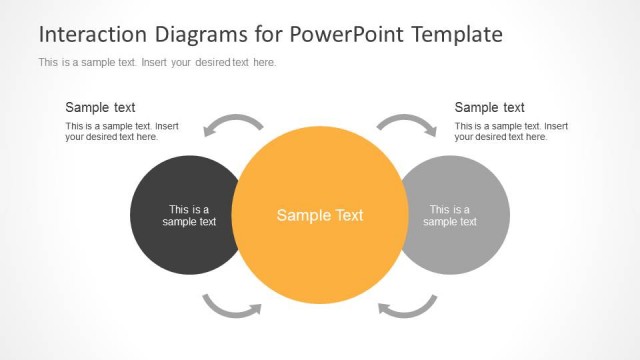
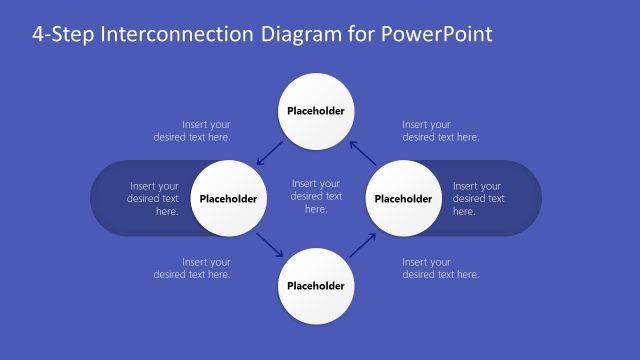
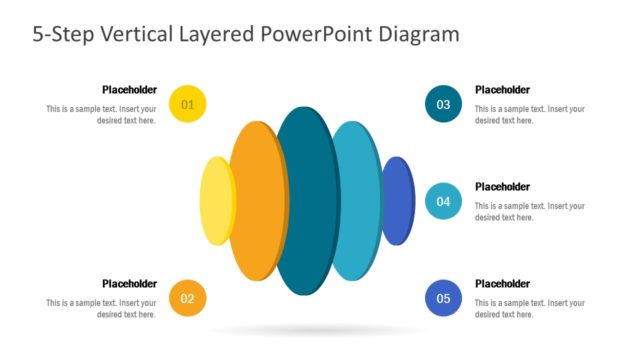
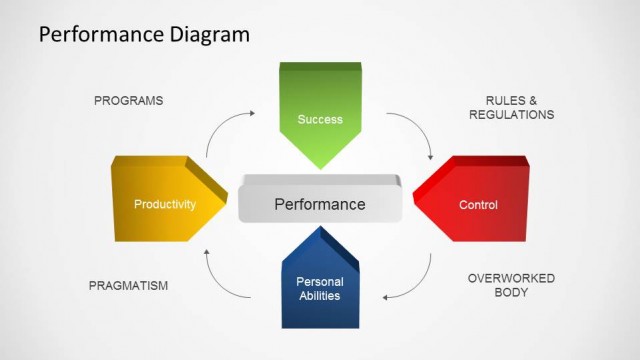
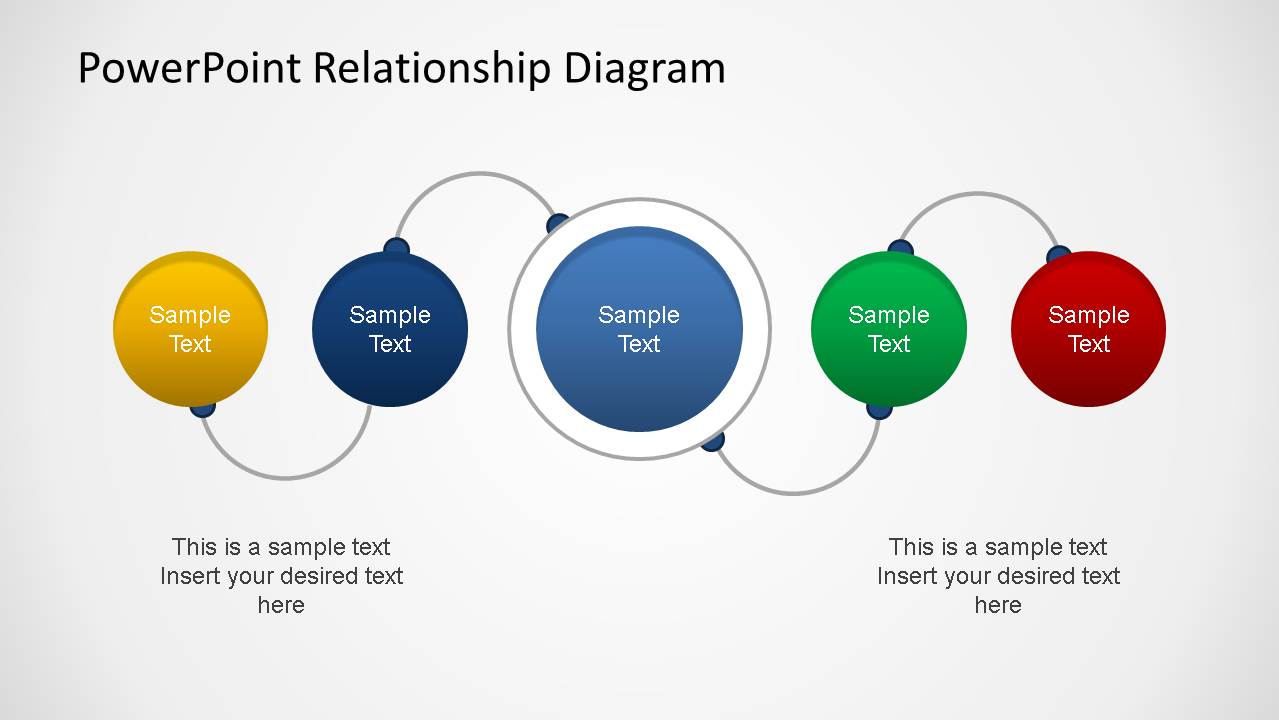
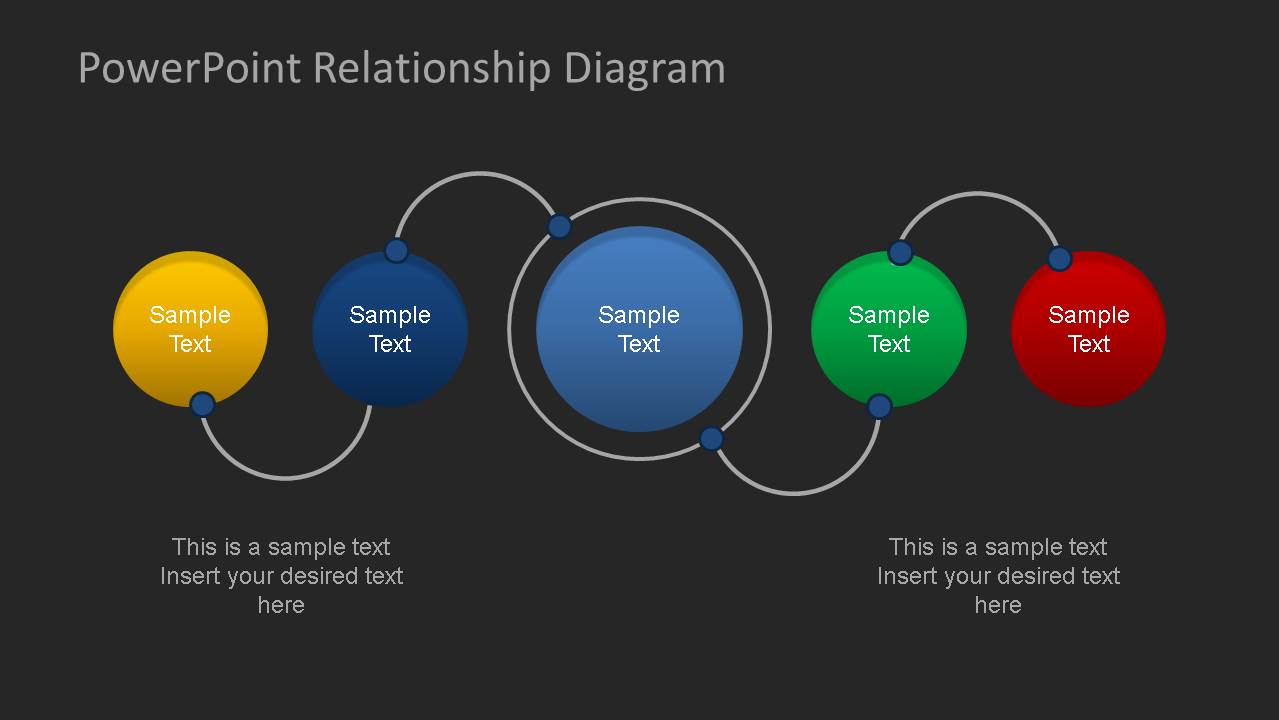
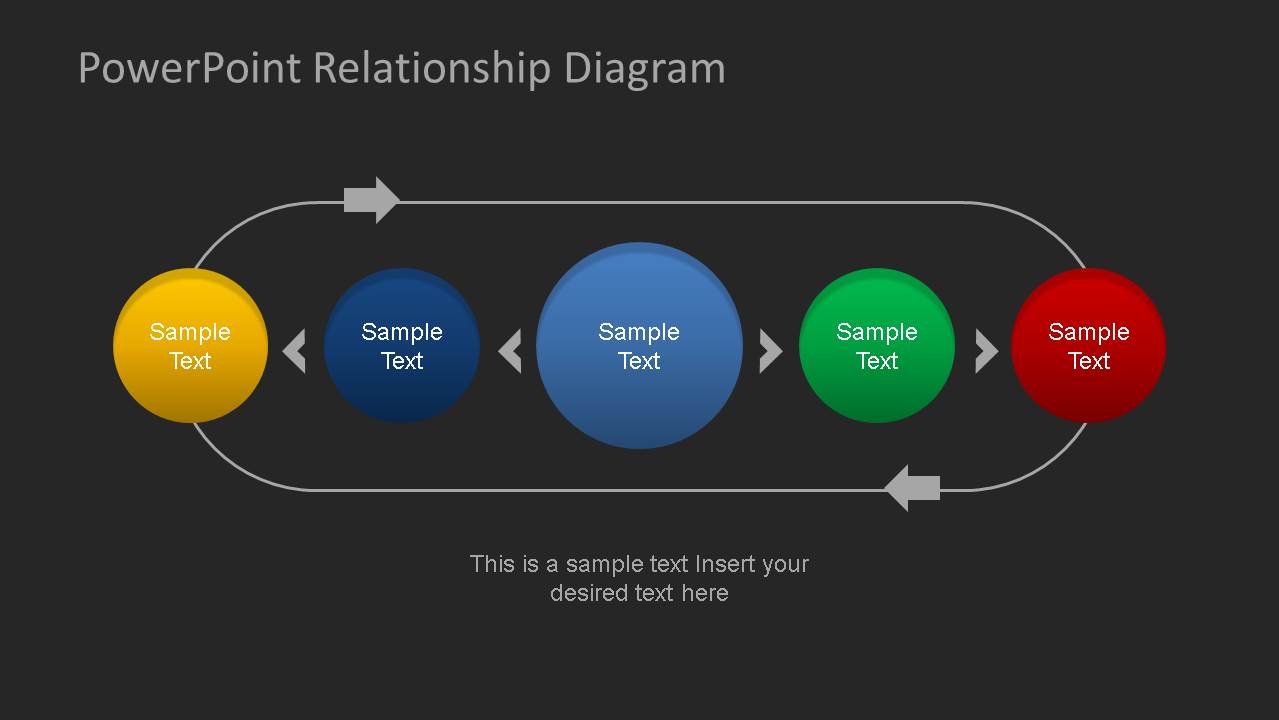
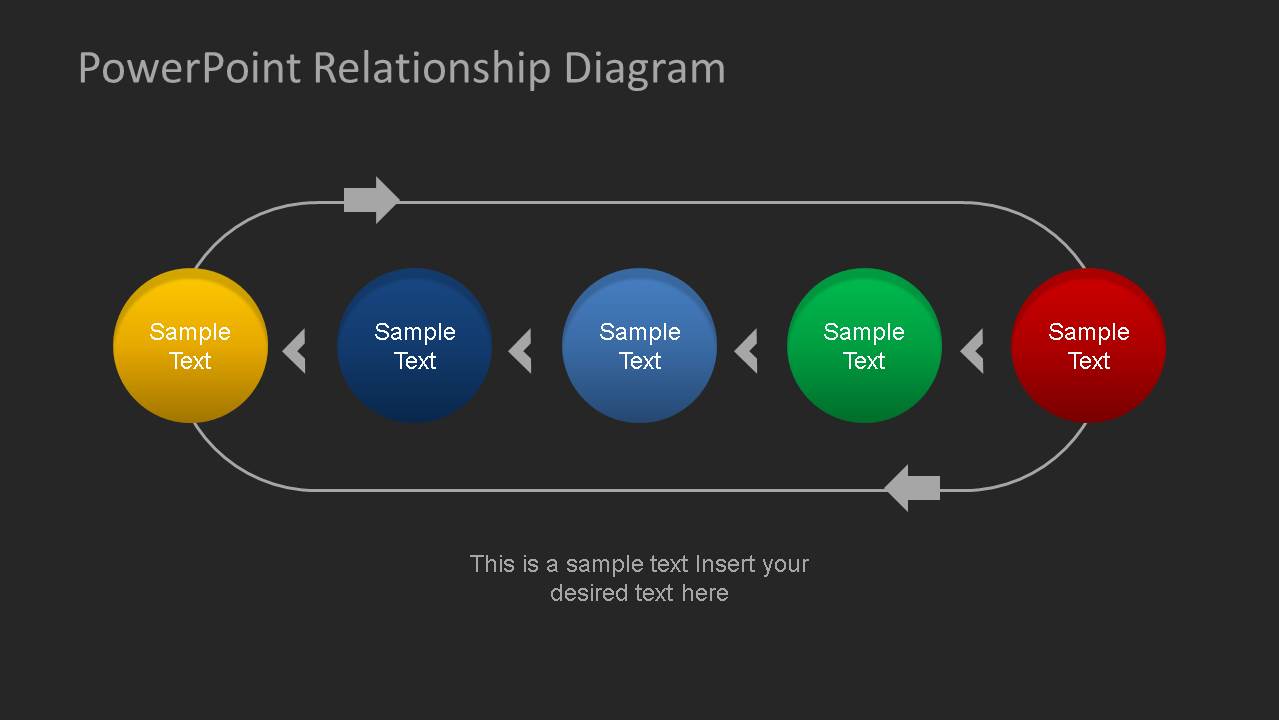
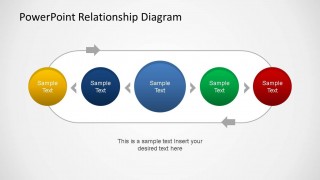
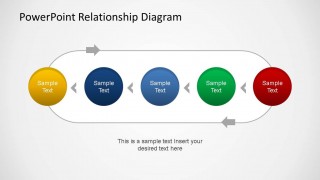
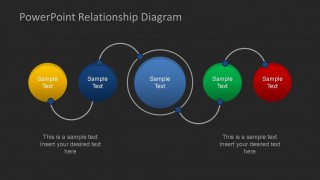
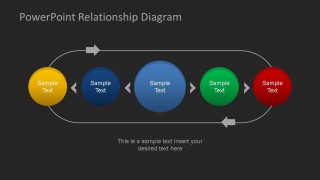
PowerPoint Relationship Diagram is a simple presentation with a set of spheres related with connectors inside a process flow. The user can edit each of the spheres in all of their properties as they are created as PowerPoint objects. With this flexibility different models can be adapted into this diagram as Process Flows or Horizontal Tree Structures. Impress your audience with this professional PowerPoint Relationship Diagram.
What’s inside this template
Example presentation scenarios
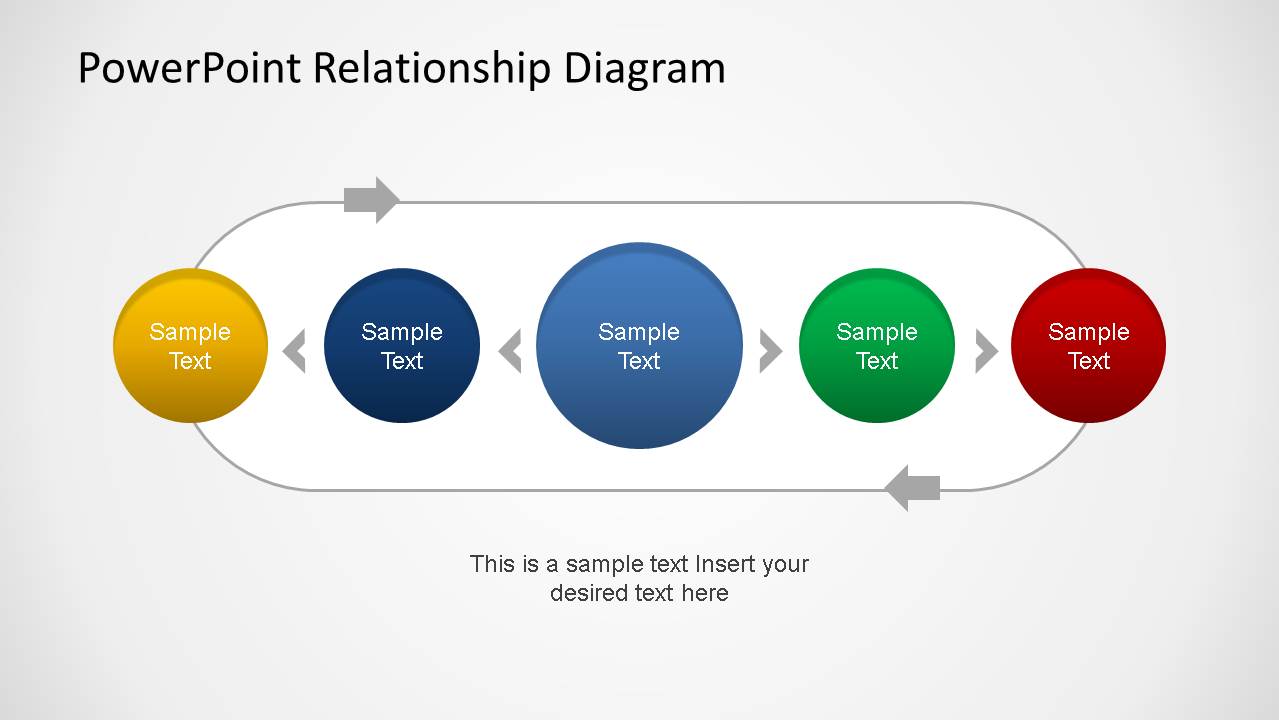
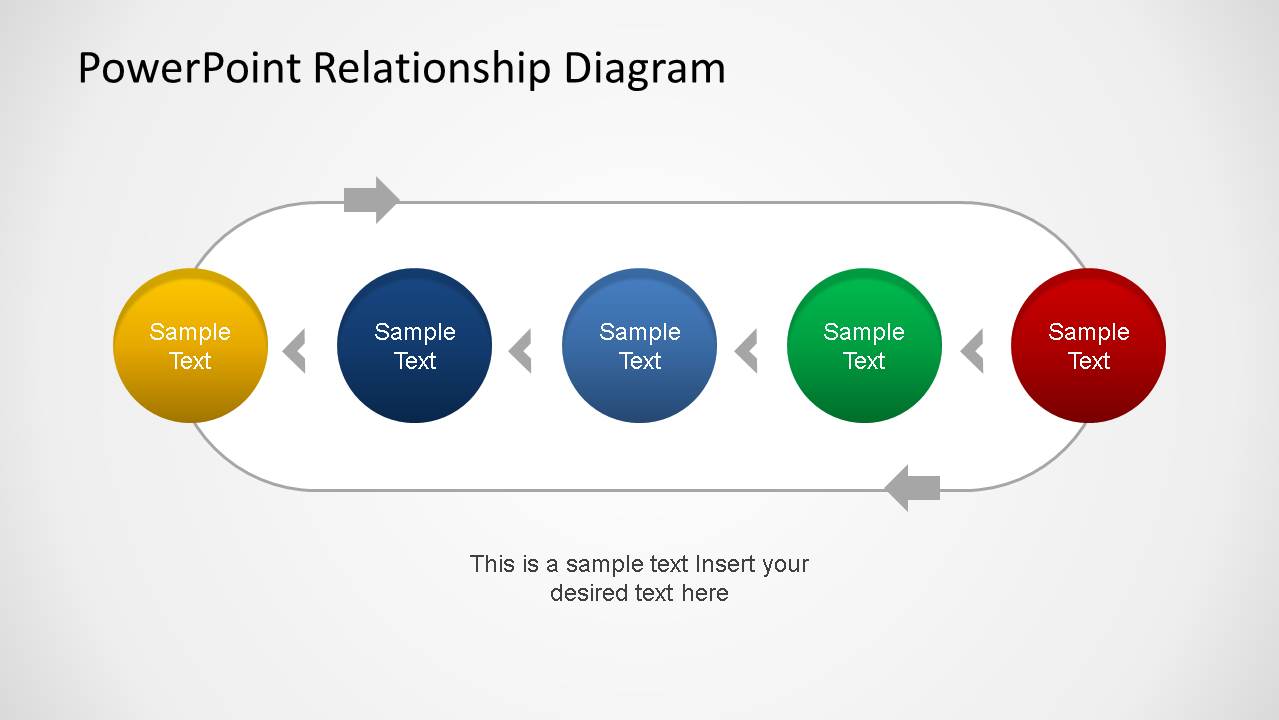
- A project manager can use the five-node loop diagram to explain how five workstreams depend on one another and where feedback returns to an earlier step.
- A consultant can use the curved arc relationship map to show how a central capability connects to supporting activities during a client strategy session.
- An operations leader can use the dark-background process flow to present a 5-step workflow in an executive review where directional movement must be clear.
- A trainer can use the light-background horizontal relationship flow to introduce five concepts and explain the connection between each concept before moving into detail.
Features
- 100% editable presentation template
- Compatible with Microsoft PowerPoint and Google Slides
- 16:9 aspect ratio slides
- Scalable vector shapes, icons and illustrations
- AI-Ready for Microsoft Copilot and Claude
- Instant access and download
Frequently asked questions
Q: How should a presenter structure the message around this relationship diagram?
A: Start by naming what each sphere represents before explaining the connectors. The loop arrows are useful for showing feedback, repetition, or return paths, while the chevrons suggest step-to-step movement. Keep each label short so the audience can follow the relationship first, then use the caption area for one supporting insight.
Q: Who is this template best suited for in a business presentation?
A: This template fits presenters who need to explain relationships without building a detailed chart or process map. Project managers, consultants, analysts, and team leads can use it to show five linked phases, dependencies, inputs, or decision points in a compact visual that works for briefings, workshops, and planning discussions.
Q: Why does the sphere-and-connector design help communicate relationships?
A: The sphere nodes make each item feel like a distinct element, while the curved connectors and loop arrows show interaction rather than a simple list. The enlarged central node in some slides creates a focal point, which helps the presenter frame one item as the hub, driver, or main dependency in the relationship.
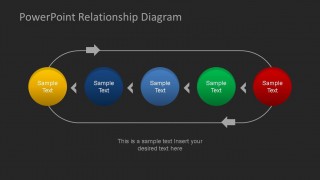
PowerPoint Relationship Diagram
6-slide relationship diagram presentation template with 5-step process flow and connected sphere layouts
PowerPoint Relationship Diagram is a 6-slide diagram template for showing connected steps, relationships, and process loops. It includes five-node sphere flows, curved arc relationship maps, looped arrow paths, and light or dark background versions. It is built for business presenters using Microsoft PowerPoint or Google Slides.
- Category
- Diagrams
- Rating


 Loading...
- Aspect ratio
- 16:9
- Item ID
- 6417-02
- Colors
 Microsoft PowerPoint
  Microsoft Copilot
  Claude for PowerPoint
 Other formats supported
Subscribe today and get immediate
access to download our PowerPoint templates.