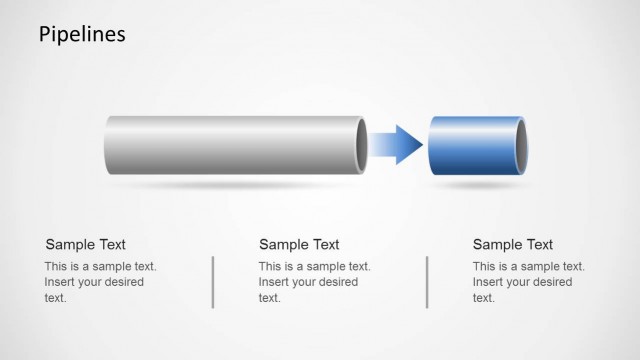
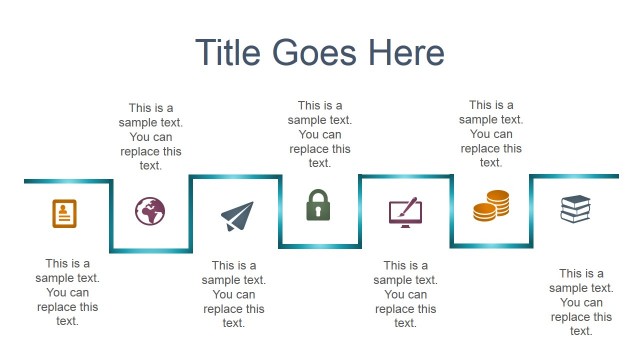
Pipeline Shapes PowerPoint Template is a creative presentation design that you can use to make a business presentation with pipeline analogy graphics.
You can use the pipeline graphics for PowerPoint to describe a process flow or highlight the benefits of a performance management process with a pipeline analogy.
You can use this pipelines PowerPoint template as a toolkit and combining the editable pipeline components you can create custom layouts and PowerPoint slide designs that can help to describe a process or flow in a business presentation.
What’s inside this template
Example presentation scenarios
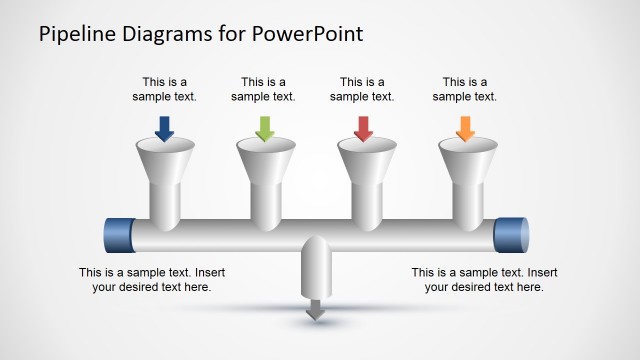
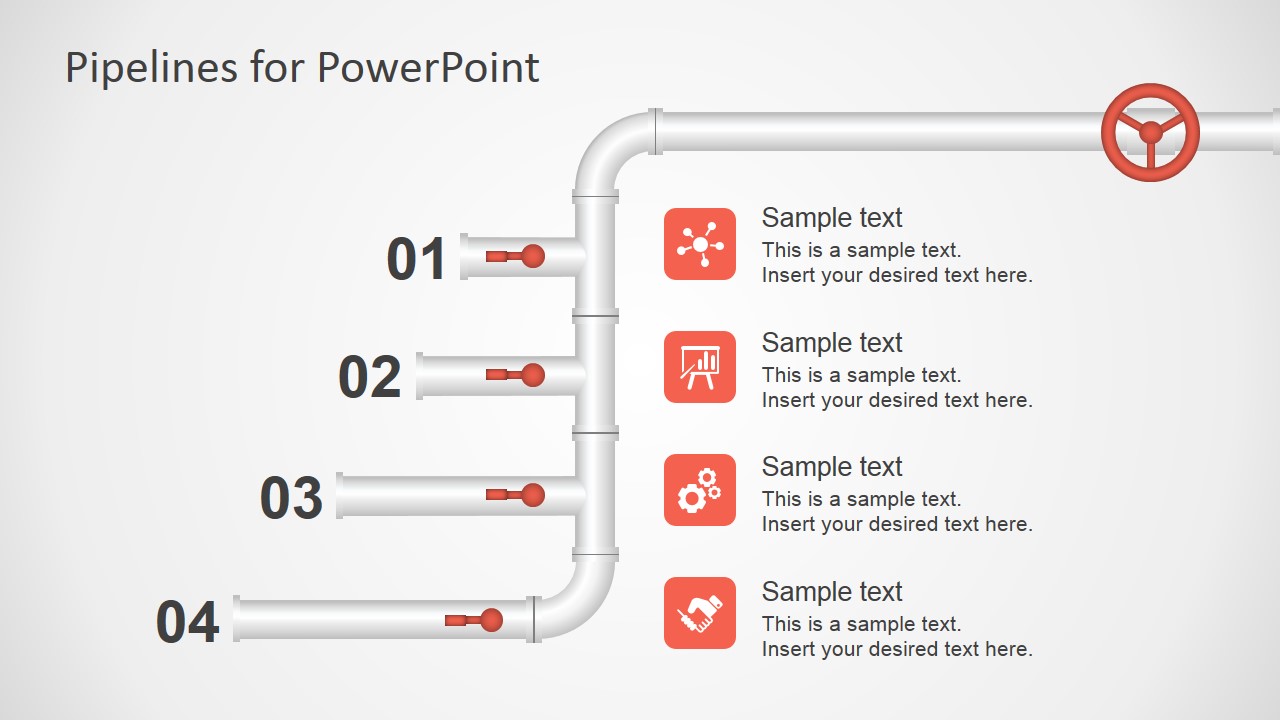
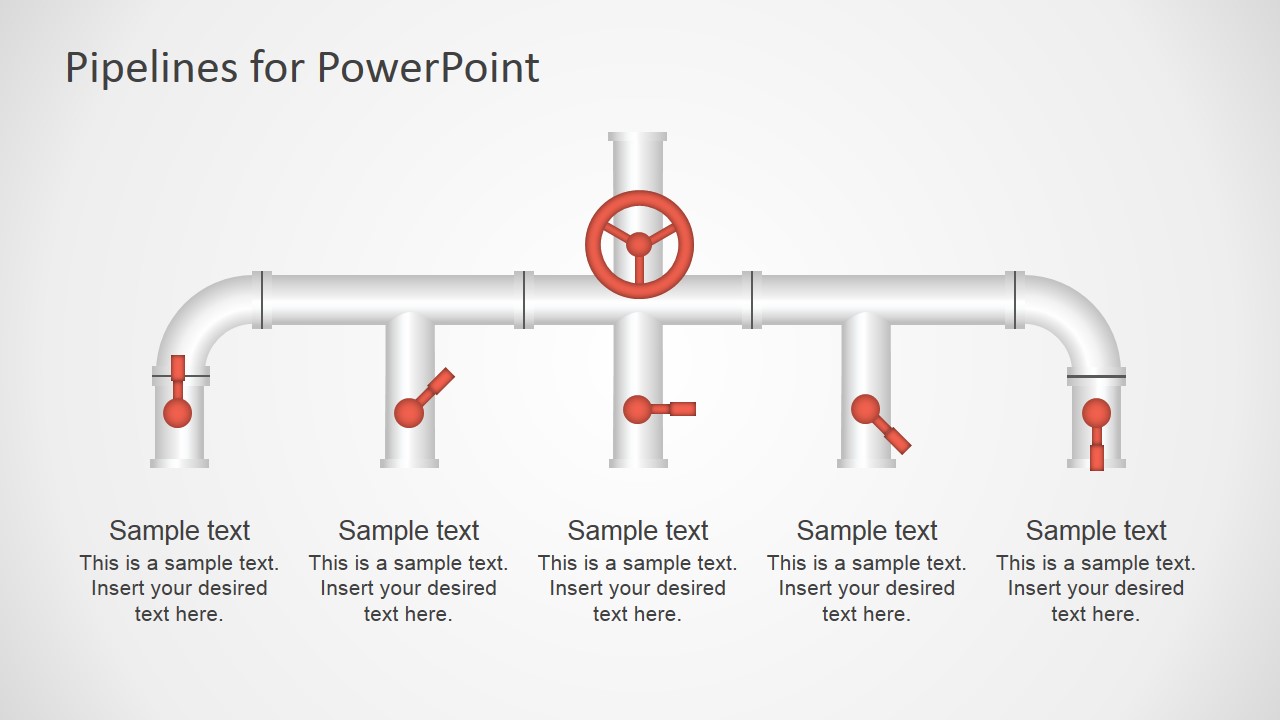
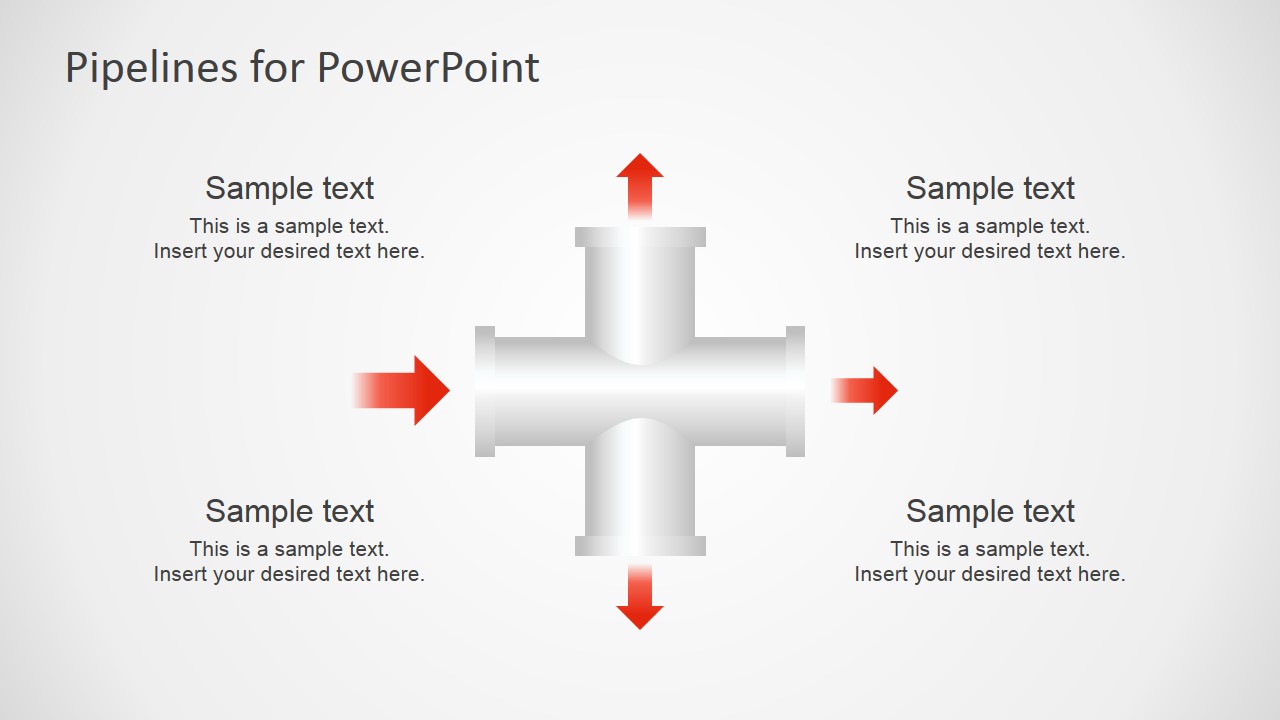
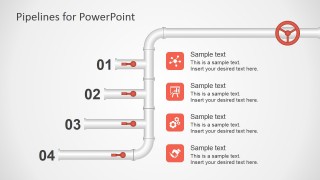
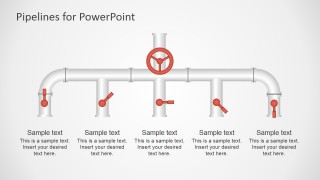
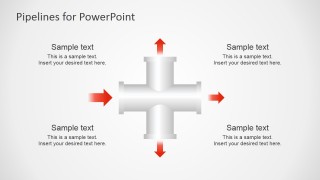
- An operations manager can explain how requests enter, split, and exit a workflow by using the numbered intake flow and multi-outlet pipeline layouts.
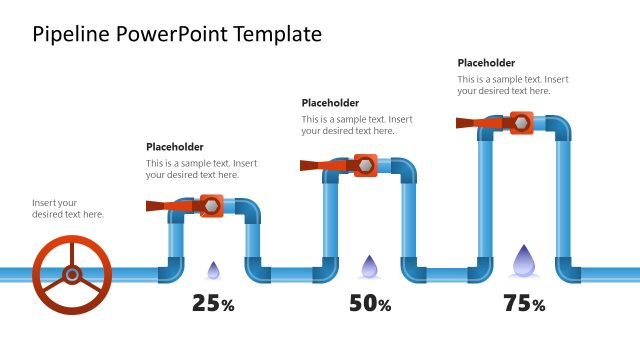
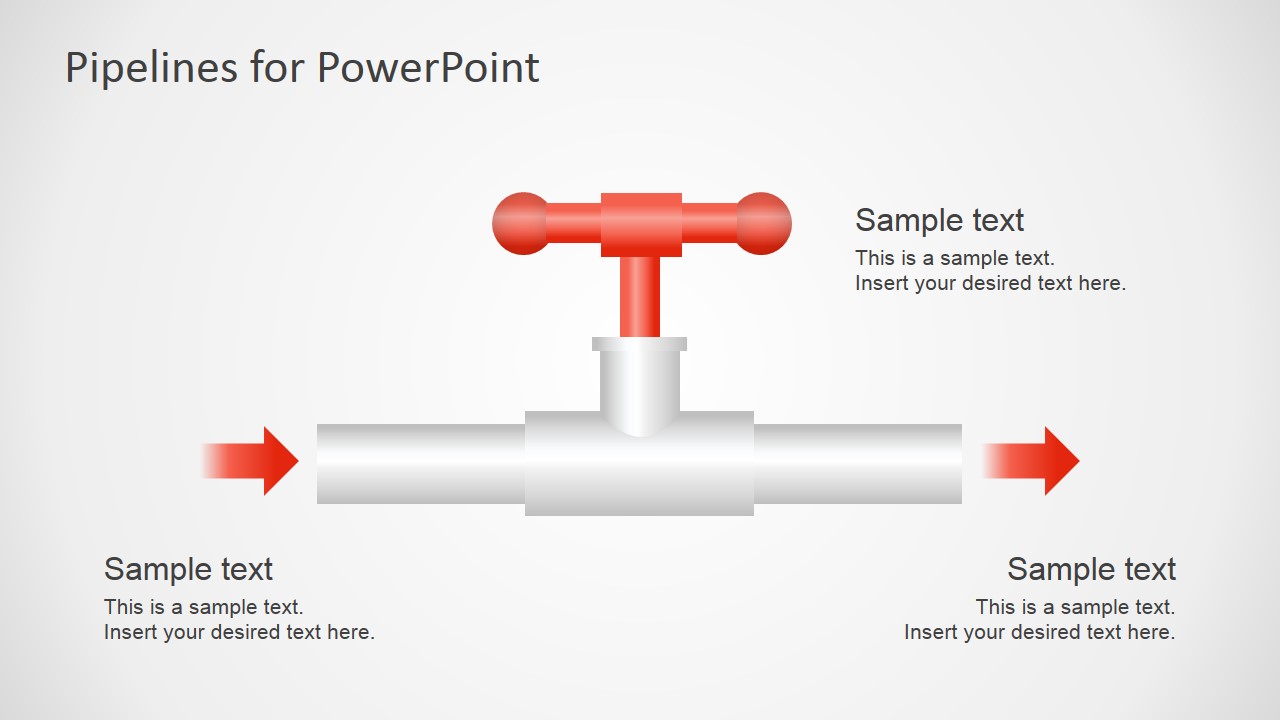
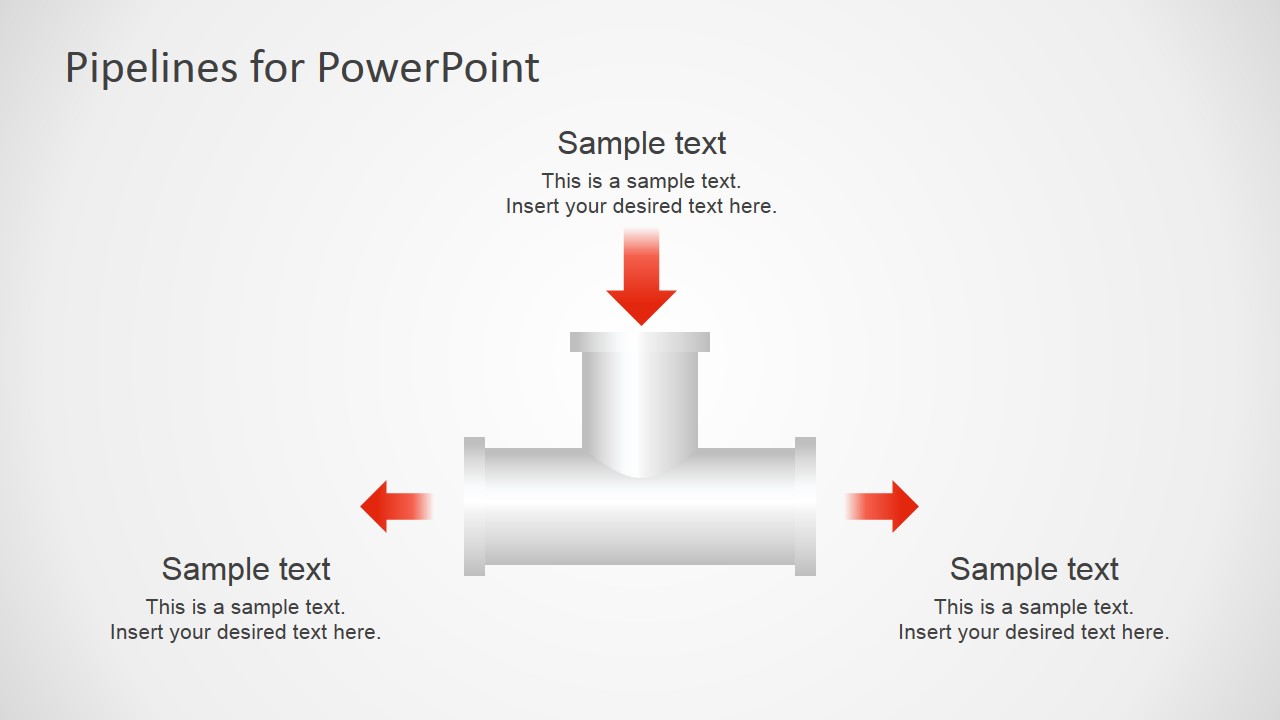
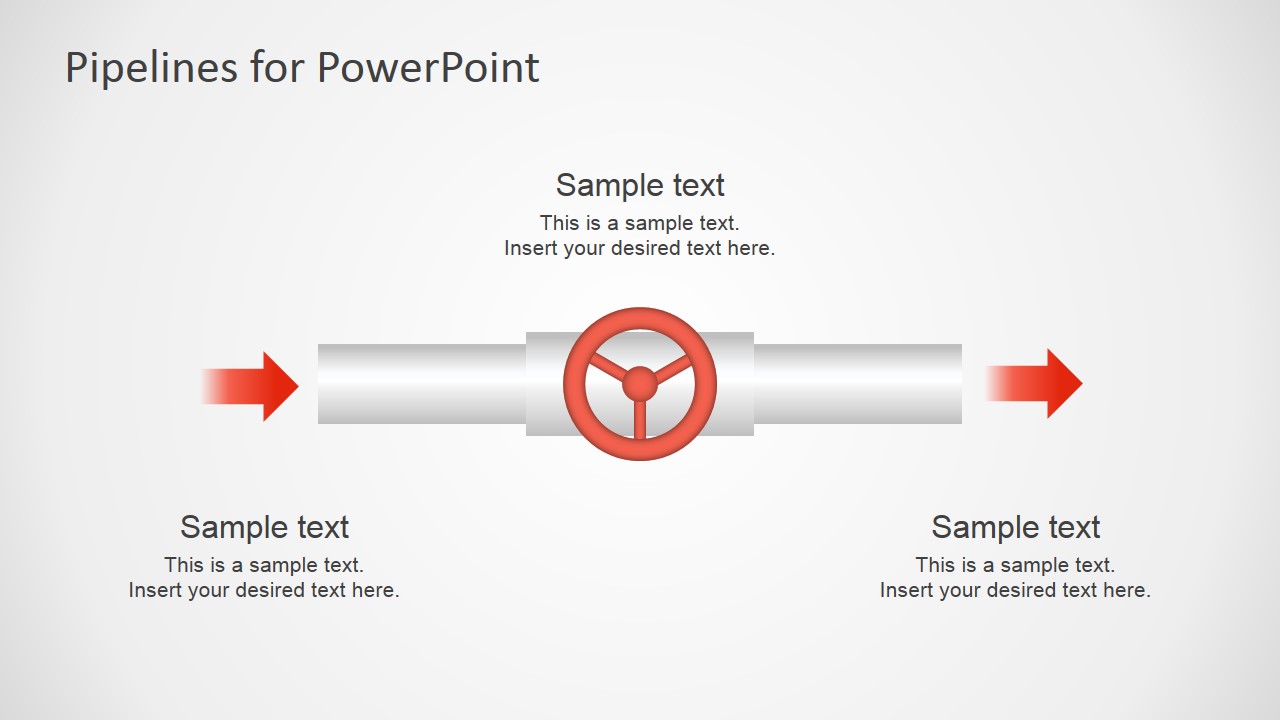
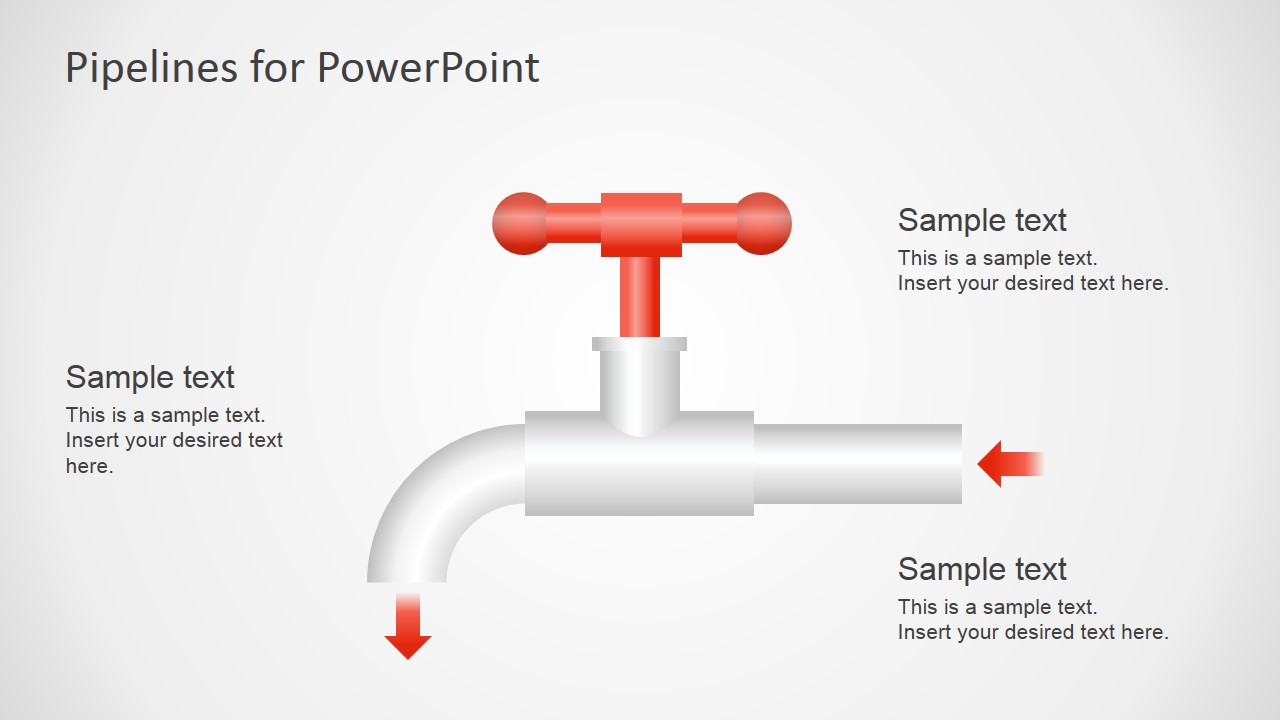
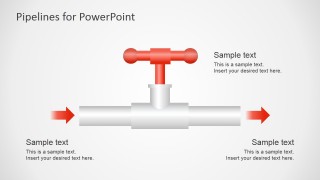
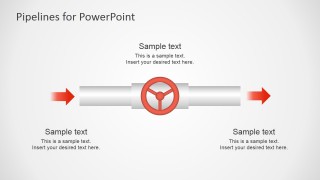
- A process improvement consultant can show where control points affect throughput by presenting the valve diagrams, red arrows, and surrounding callout text.
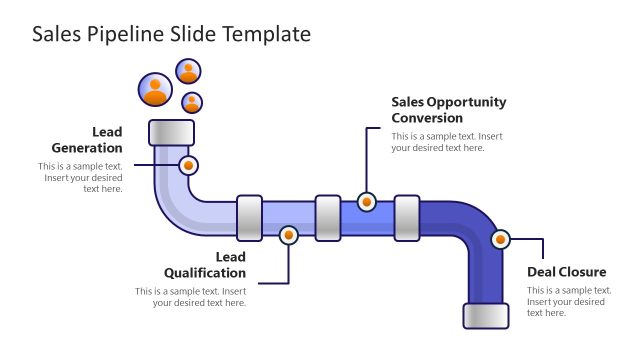
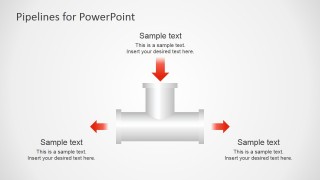
- A sales operations leader can describe lead movement from intake to conversion by adapting the branch pipeline and icon library to represent teams, tasks, and handoffs.
- A project manager can build a custom process map from the component library slide, combining pipe segments, elbows, junctions, and valve shapes into a tailored workflow graphic.
Features
- 100% editable presentation template
- Compatible with Microsoft PowerPoint and Google Slides
- 16:9 aspect ratio slides
- Scalable vector shapes, icons and illustrations
- AI-Ready for Microsoft Copilot and Claude
- Instant access and download
Frequently asked questions
Q: How should I present a workflow using the pipeline metaphor?
A: Start by defining what flows through the pipeline, such as leads, tasks, approvals, or materials. Use the numbered intake slide to introduce inputs, then use the valve and branch diagrams to explain control points, routing decisions, and outputs. Keep each callout short so the audience follows the direction of movement first.
Q: Who is this template best suited for?
A: This template fits presenters who need to make an abstract process feel concrete. Operations managers, process analysts, consultants, and sales operations teams can use the pipeline layouts to show how work enters a system, where it is controlled, and how it moves to different outcomes without building a full technical process map.
Q: Why do pipe, valve, and arrow visuals help explain process flow?
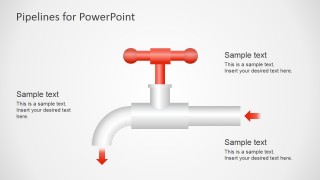
A: The pipeline metaphor gives the audience a familiar mental model for movement, pressure, blockage, and control. Red arrows show direction, valves imply decision or regulation points, and branch pipes make parallel paths visible. This reduces reliance on long text lists and helps viewers understand cause and flow relationships faster.






Pipeline Shapes PowerPoint Template
10-slide presentation template with pipeline process flow shapes, valve graphics, and workflow icons
The Pipeline Shapes PowerPoint Template is a 10-slide presentation template for explaining workflows with pipeline analogy graphics. It includes a numbered intake flow, multi-outlet distribution pipe, valve control diagrams, branch and junction layouts, and an icon library. It fits business process, operations, and performance management presentations in Microsoft PowerPoint and Google Slides.
- Category
- Shapes
- Rating


 Loading...
- Aspect ratio
- 16:9
- Item ID
- 6944-01
- Colors
 Microsoft PowerPoint
  Microsoft Copilot
  Claude for PowerPoint
 Other formats supported
Subscribe today and get immediate
access to download our PowerPoint templates.