Showcase the aspects of talent management using our editable Performance vs Potential Matrix Template for PowerPoint. The performance vs potential matrix is a talent management tool that organizations utilize to examine the potential and performance of the employees for their future growth and development. This retrospective analysis helps professionals estimate their employees’ future contributions and abilities. The template has two slides with different visual compositions. The first slide has a 3×3 matrix made with square boxes. There is a heading at the start of each column and row in the table. The performance has the following three levels:
- Needs Development
- Meets Expectation
- Exceeds Expectation
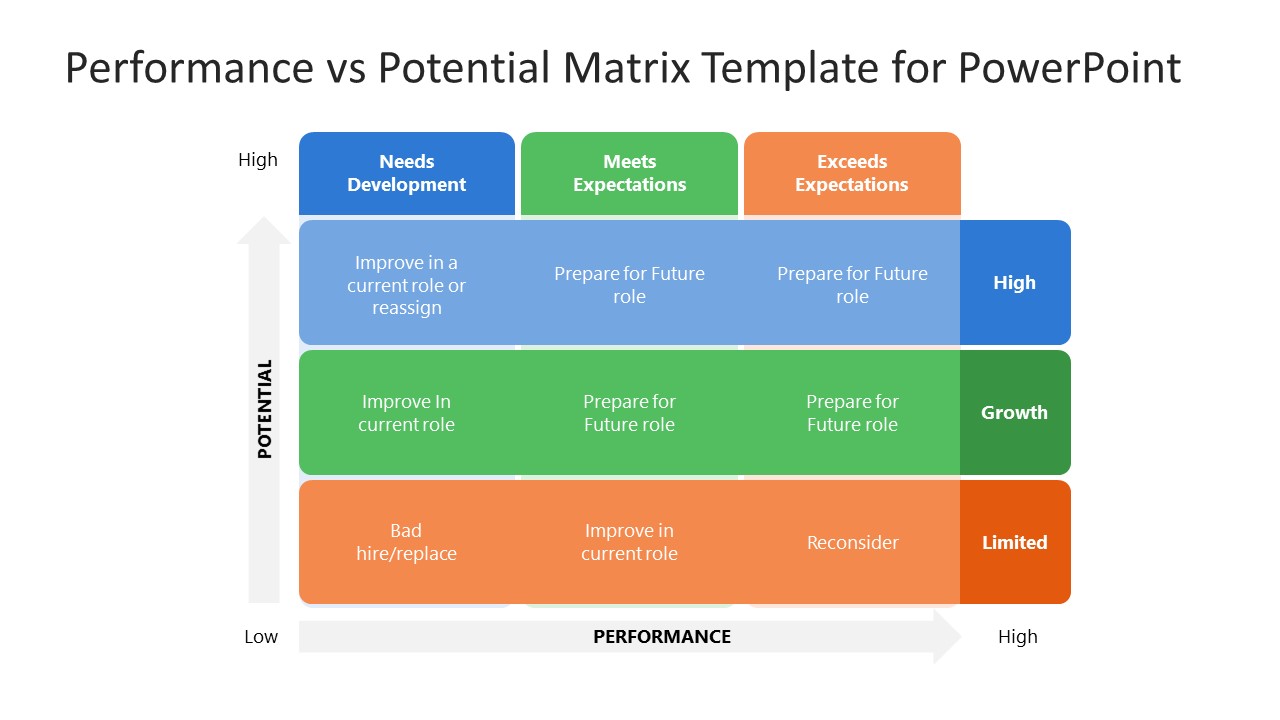
The leadership potential is of three levels, i.e., limited, moderate, and high; professionals can discuss the talents in their company in an organized and comprehensive way. The second slide of the Performance vs Potential Matrix Template for PowerPoint has similar data but has long extended rows with a bright color scheme. The matrix looks modern and captivates the audience’s attention. It helps professionals, corporate managers, and HR heads to communicate their ideas effectively. Also, our PPT template is 100% editable and can be customized with all PowerPoint versions, Google Slides, and Keynote.
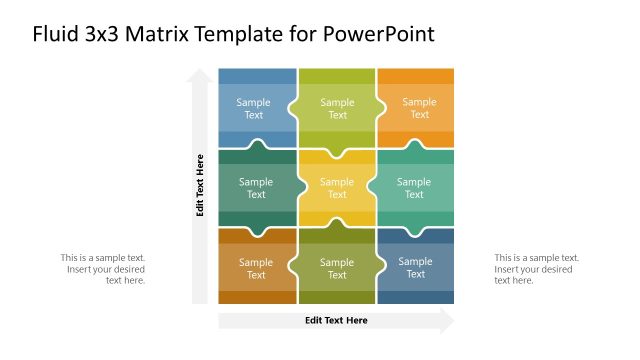
You can also download our fluid 3×3 matrix template to try a different graphical layout for your performance vs. potential matrix. Moreover, users can change the matrix’s design, arrangement of textboxes, color scheme, and other PPT features used in the template. They can also repurpose the template to present other matrix charts. Download our performance vs. potential matrix template and customize it for your business presentations to show the predictive assessment results! Also, check our collection of matrix templates.
What’s inside this template
Example presentation scenarios
- An HR business partner can use the square 3x3 matrix to guide a talent calibration meeting and place employees by current performance and leadership potential.
- A department manager can use the horizontal action matrix to explain development actions, such as preparing an employee for a future role or improving performance in the current role.
- An executive team can use the performance and potential axes to compare leadership bench strength across teams and identify high-potential employees.
- An organizational development consultant can use the color-coded cells to frame a performance improvement plan and discuss where coaching, reassignment, or replacement may be needed.
Features
- 100% editable presentation template
- Compatible with Microsoft PowerPoint and Google Slides
- 16:9 aspect ratio slides
- Scalable vector shapes, icons and illustrations
- AI-Ready for Microsoft Copilot and Claude
- Instant access and download
Frequently asked questions
Q: How should a presenter explain the matrix without reducing people to labels?
A: Start by defining the two axes before showing names or examples. Explain that performance describes current role results, while leadership potential describes readiness for broader responsibility. Then use the 3x3 cells as discussion prompts for development decisions, not permanent labels, so the audience focuses on action and coaching.
Q: Who is this template best suited for?
A: This template fits HR leaders, managers, and talent committees that need a simple visual frame for employee review. It is especially useful in calibration sessions, succession planning, and performance improvement meetings where the goal is to align leaders on development, readiness, and role-fit decisions.
Q: Why use two different matrix designs for the same assessment?
A: The first slide is best for categorizing employees because the numbered 3x3 grid makes each talent segment easy to reference. The second slide shifts the same logic into action planning, using longer bands and recommendation text to connect each position to a management response.



Performance vs Potential Matrix Template for PowerPoint
2-slide presentation template with 3x3 talent matrix layouts for performance review and leadership potential
The Performance vs Potential Matrix Template for PowerPoint is a 2-slide matrix chart template for HR, managers, and talent leaders. It includes a square 3x3 performance and leadership potential grid plus a horizontal action-planning matrix with performance and potential axes. It is built for Microsoft PowerPoint and Google Slides.
- Category
- Matrix Charts
- Rating

 Loading...
- Aspect ratio
- 16:9
- Item ID
- 22406-01
- Colors
 Microsoft PowerPoint
 Microsoft Copilot
 Claude for PowerPoint
Other formats supported
Subscribe today and get immediate
access to download our PowerPoint templates.