New York City PowerPoint Template is a presentation design containing New York city landscapes and useful icons that you can download to make presentations on New York.
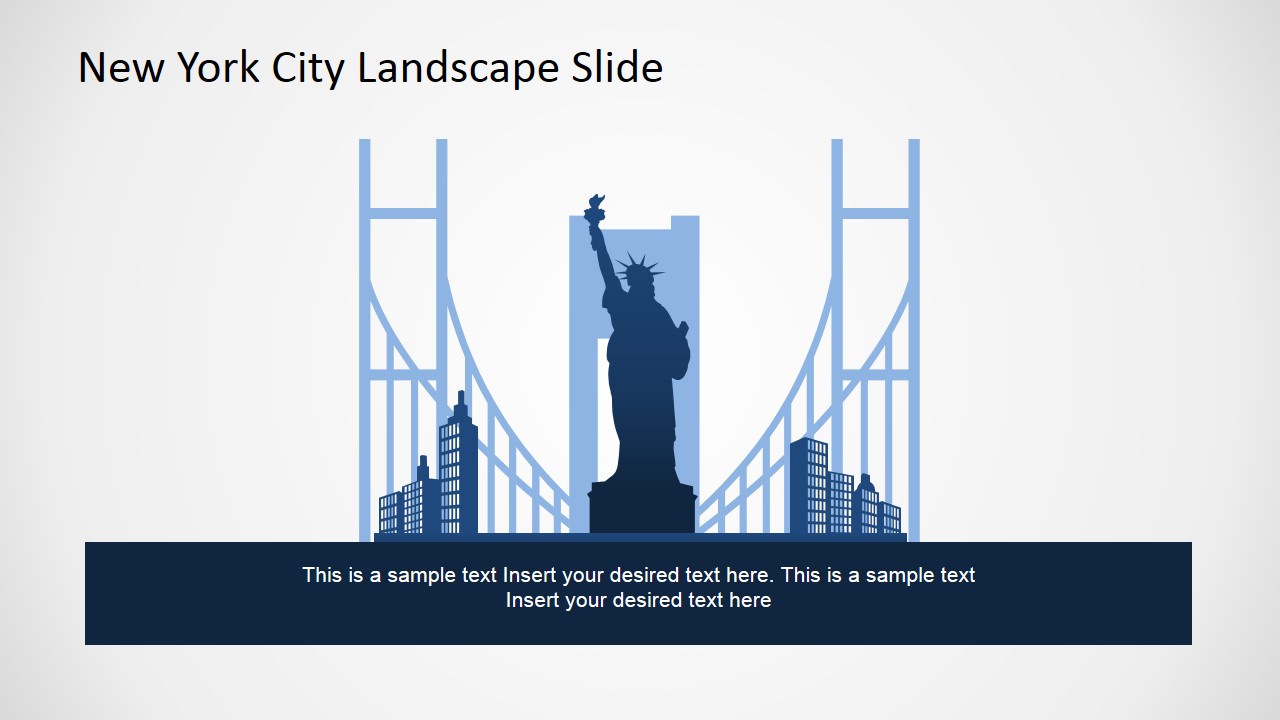
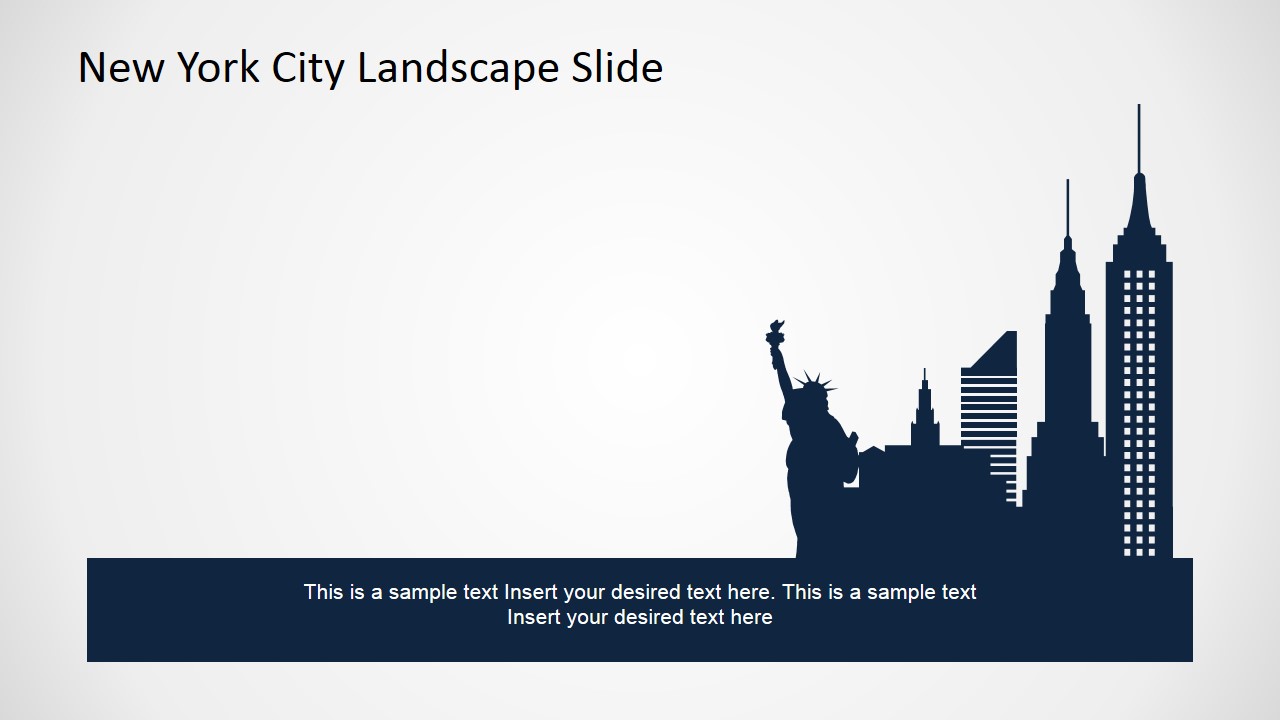
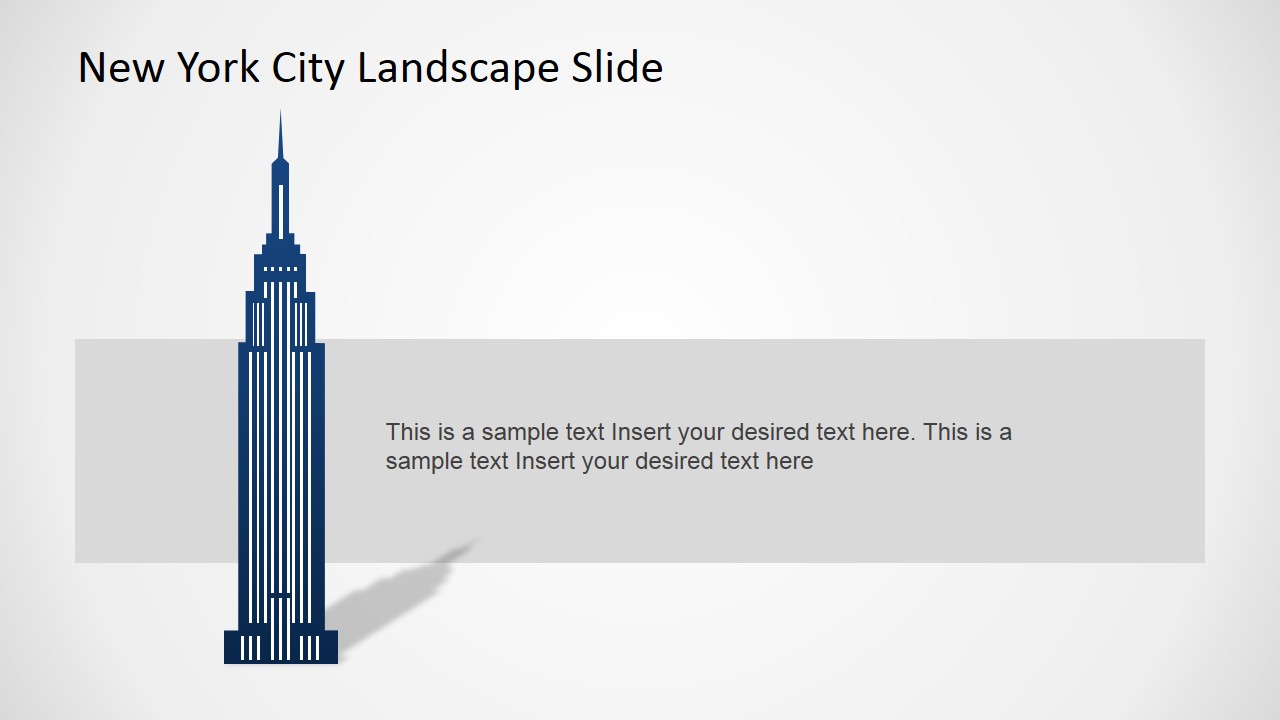
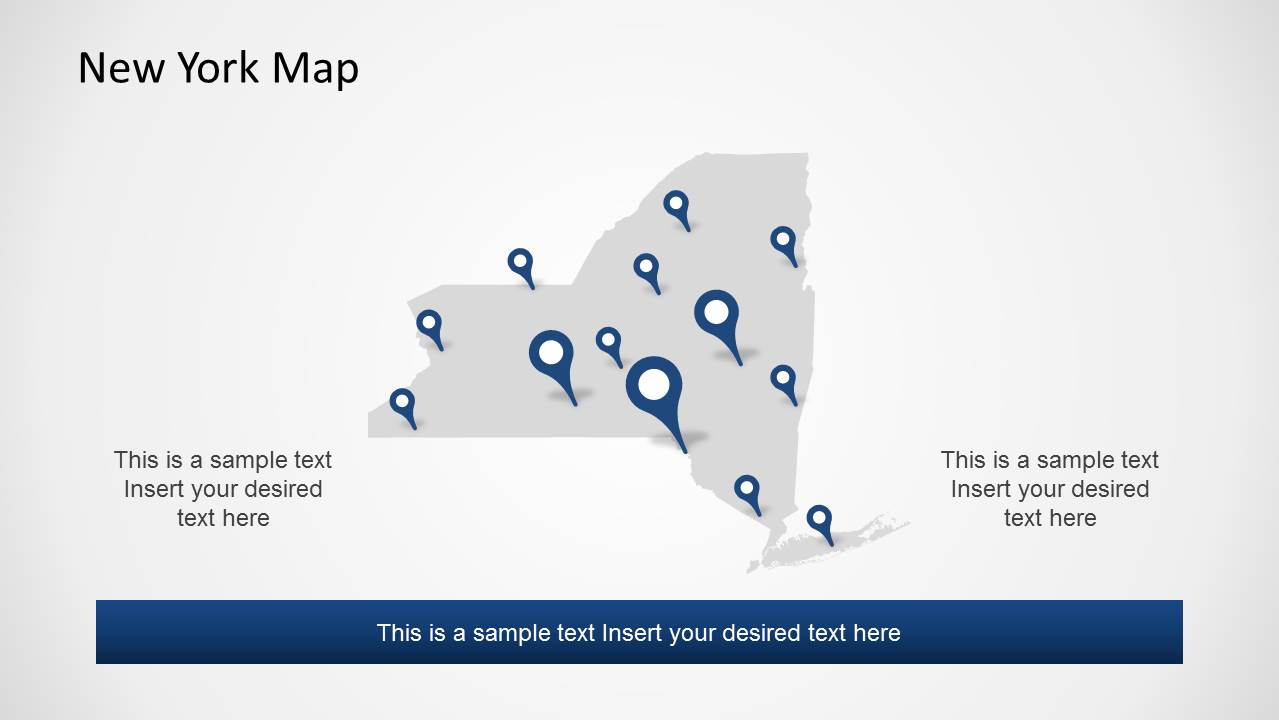
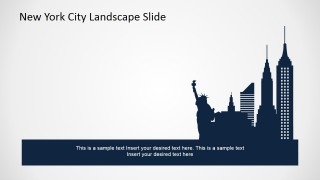
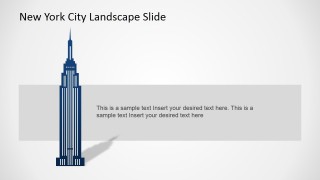
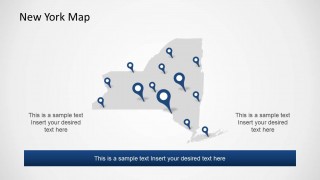
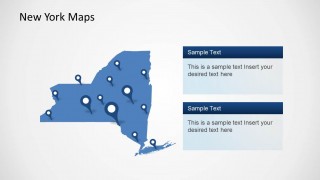
The New York template for PowerPoint contains a cover slide with the New York skyline. Then, inside the presentation you can find popular city landmarks like Statue of Liberty, Empire State building illustration for PowerPoint, New York City maps and other graphics depicting NYC. This editable New York maps for presentations can be used in Microsoft PowerPoint and Google Slides to make presentations about New York City attractions, tours, plans and activities.
What’s inside this template
Example presentation scenarios
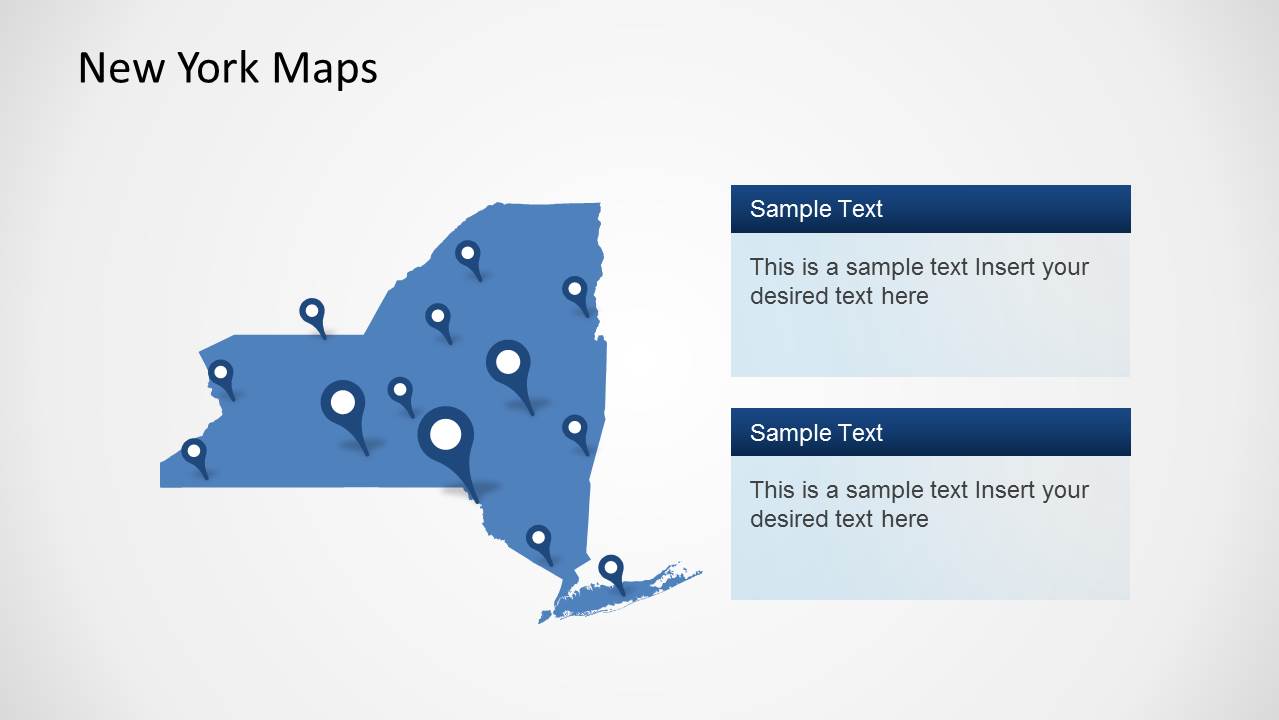
- A tourism presenter can introduce New York attractions and visitor routes using the skyline cover, Statue of Liberty landscape slide, and New York map with location pins.
- An event planner can pitch a New York program by combining the landmark landscape slides with the map callout layout to show venues, neighborhoods, or activity zones.
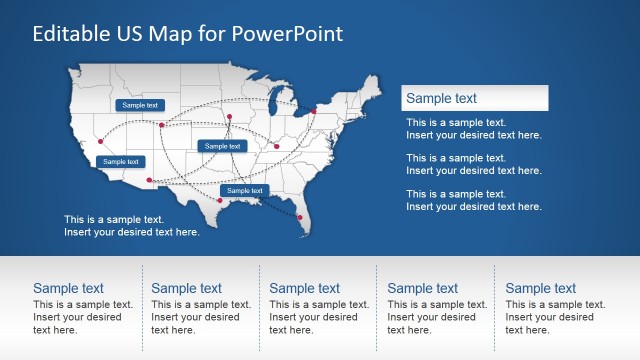
- A regional sales or operations manager can explain New York coverage using the state pin map, the United States locator map, and the stacked map callout slide.
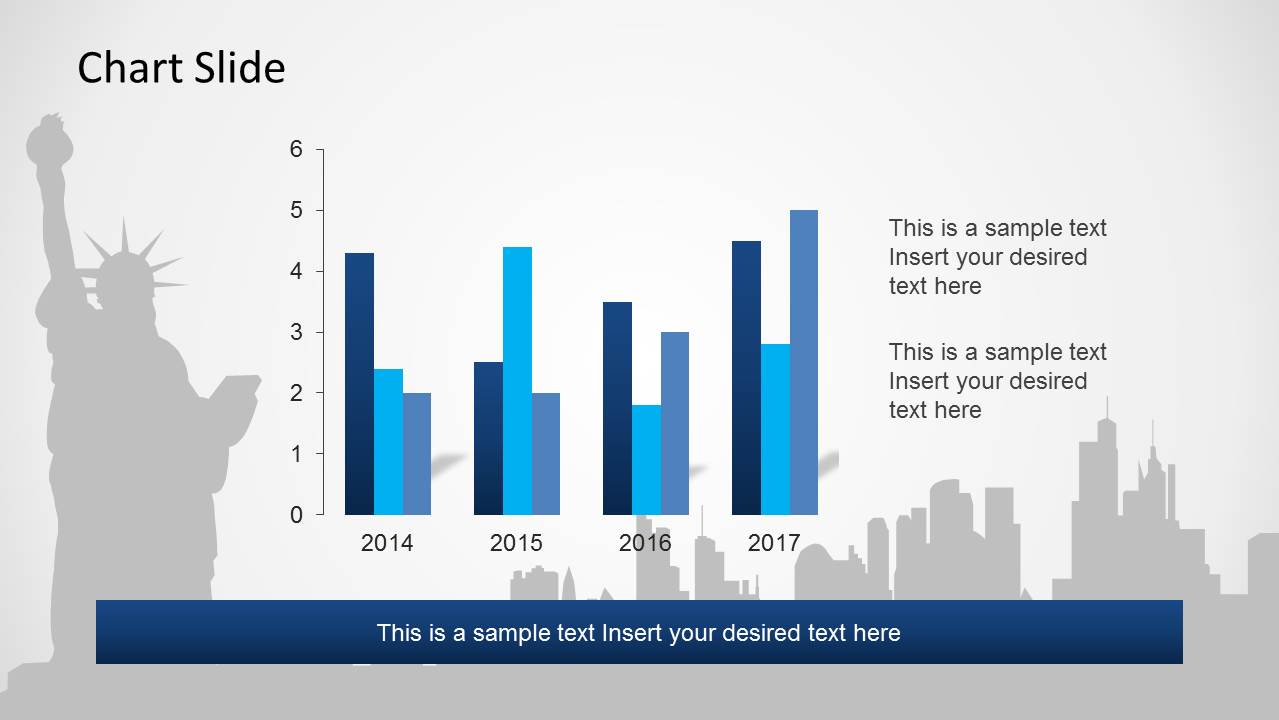
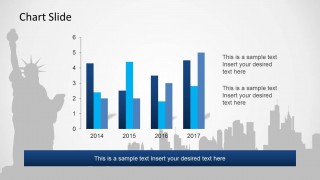
- An educator or city guide can teach a short New York overview with the Empire State Building slide, Statue of Liberty layouts, and the chart slide for simple trend data.
Features
- 100% editable presentation template
- Compatible with Microsoft PowerPoint and Google Slides
- 16:9 aspect ratio slides
- Scalable vector shapes, icons and illustrations
- AI-Ready for Microsoft Copilot and Claude
- Instant access and download
Frequently asked questions
Q: How should a presenter organize a New York destination or planning story with this template?
A: Start with one of the skyline covers to establish place immediately, then use the landmark slides for the theme or attraction focus. Move into the New York map layouts to show locations, routes, or coverage areas. Close with the chart slide only if the audience needs supporting figures, such as visitors, bookings, or activity trends.
Q: Who is this template best suited for in a business presentation?
A: This template works best for tourism teams, event planners, destination marketers, educators, and local program managers who need a concise New York visual context. The state map with pins supports location decisions, while the Statue of Liberty and Empire State Building slides create fast recognition before explaining plans, attractions, or local activity.
Q: Why do the skyline and map visuals make the message easier to follow?
A: The design uses familiar New York symbols as orientation cues, so the audience understands the location before reading details. The skyline slides act as emotional anchors, while the maps translate the topic into geography. This sequence helps presenters move from city identity to specific places, then to data on the chart slide.





New York City PowerPoint Template
10-slide New York City presentation template with skyline layouts, landmark illustrations, maps, and a chart slide
New York City PowerPoint Template is a 10-slide map and city-landmark presentation template for Microsoft PowerPoint and Google Slides. It includes skyline cover slides, Statue of Liberty and Empire State Building landscape layouts, New York state map callouts, a US locator map, and a bar chart; chart data can be edited as an Excel spreadsheet in PowerPoint.
- Category
- Maps
- Rating


 Loading...
- Aspect ratio
- 16:9, 4:3
- Item ID
- 6397-01
 Microsoft PowerPoint
  Microsoft Copilot
  Claude for PowerPoint
 Other formats supported
Subscribe today and get immediate
access to download our PowerPoint templates.