Matrix PowerPoint Template Toolkit
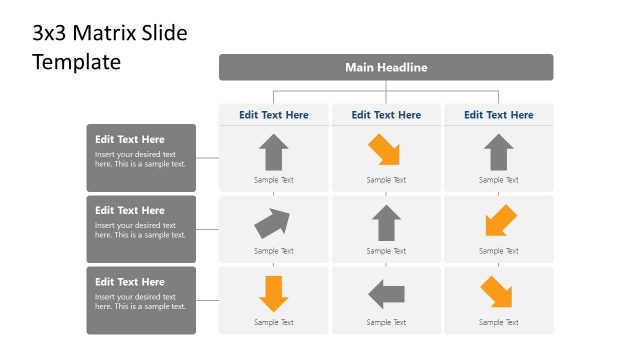
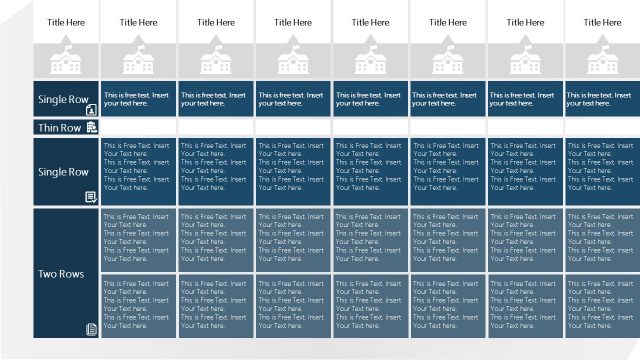
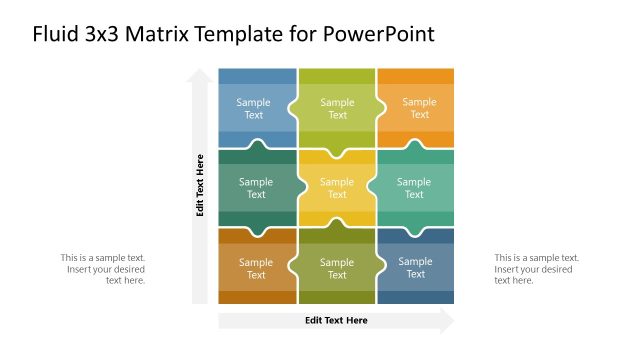
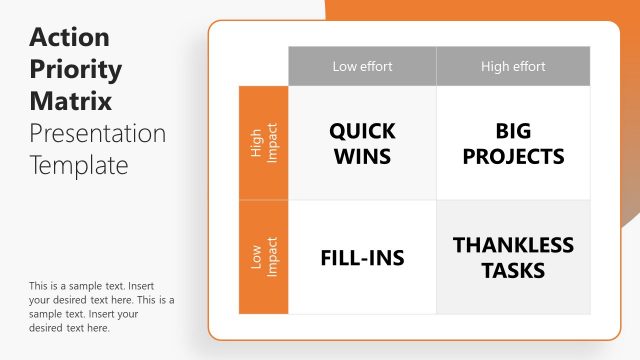
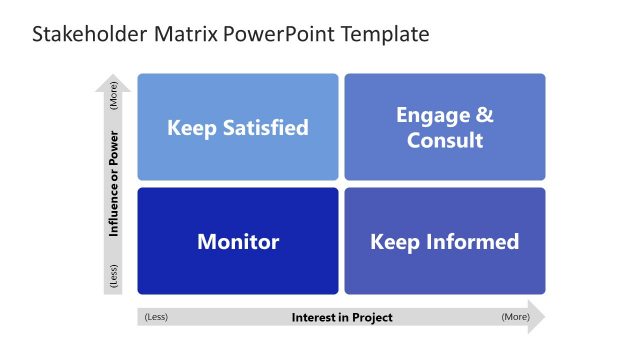
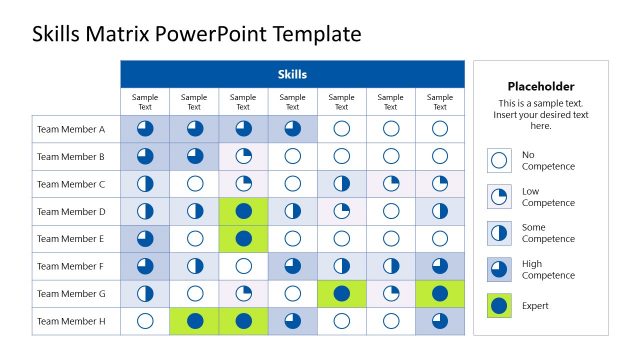
The Matrix PowerPoint Template Toolkit carries editable matrix charts for presenting data elements in tabular form. Matrix charts are the simplest to represent data and values in an understandable format. This is why professionals in every field require matrix charts to indicate their information before the audience. We have designed this matrix template toolkit for our users with multiple matrix charts options, i.e., 2×2, 3×3, and more. The styling and color scheme used in these editable matrices can be personalized according to specific requirements. The slides are compatible with all PowerPoint versions, Google Slides and Keynote.
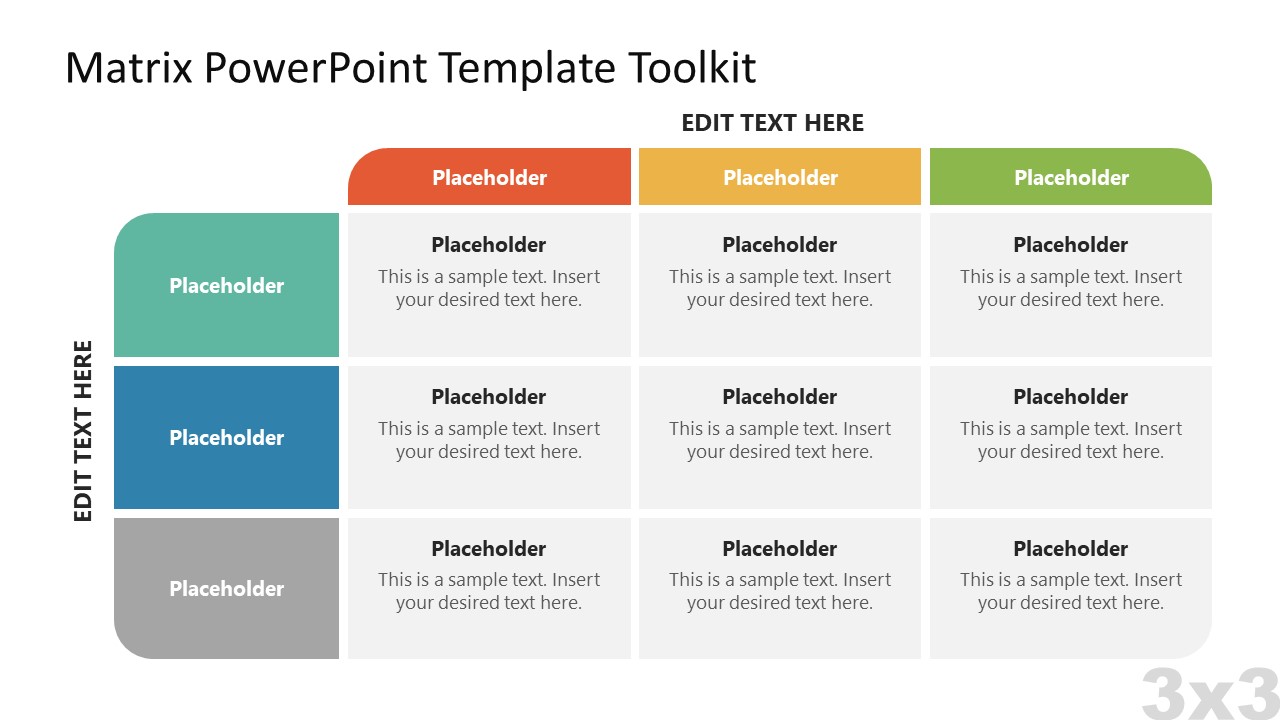
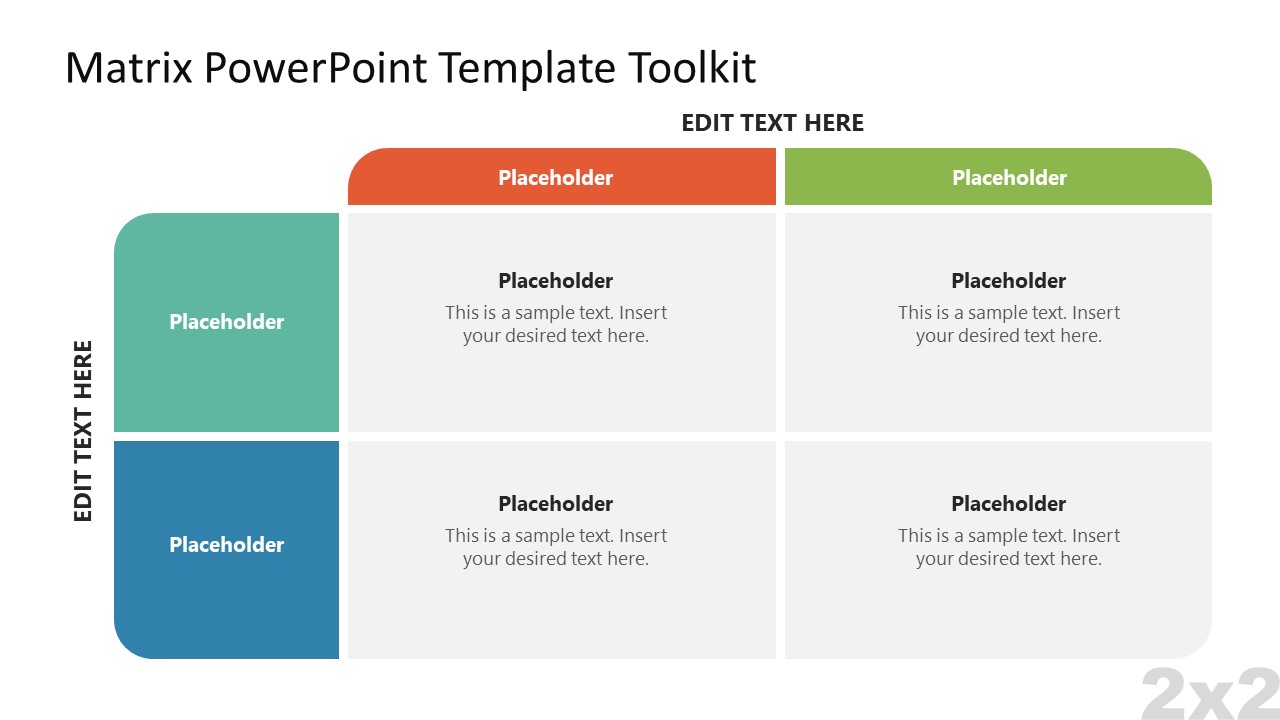
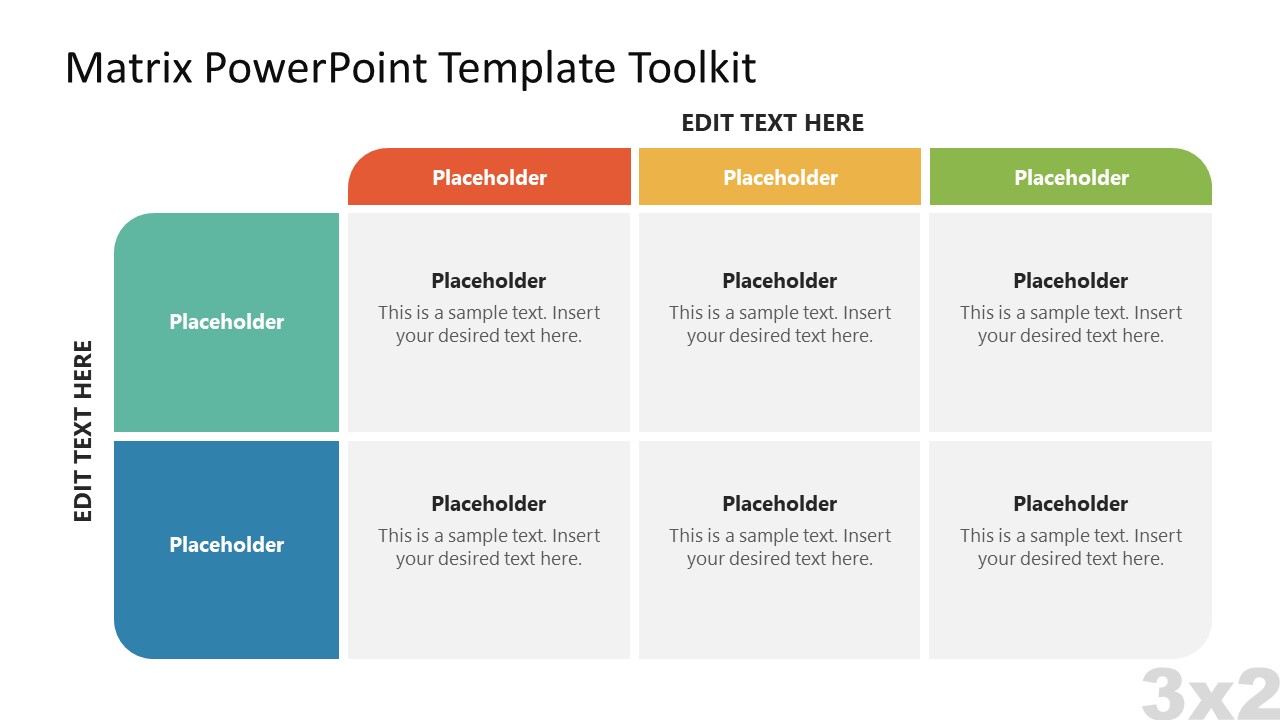
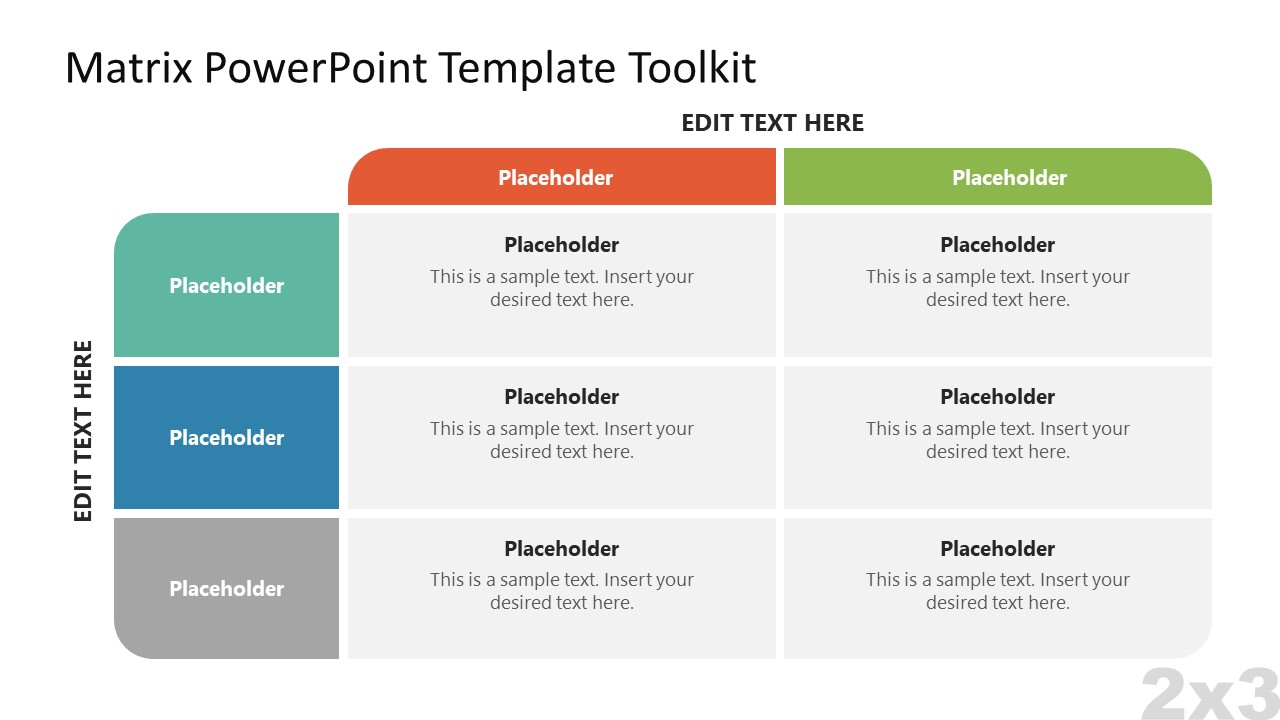
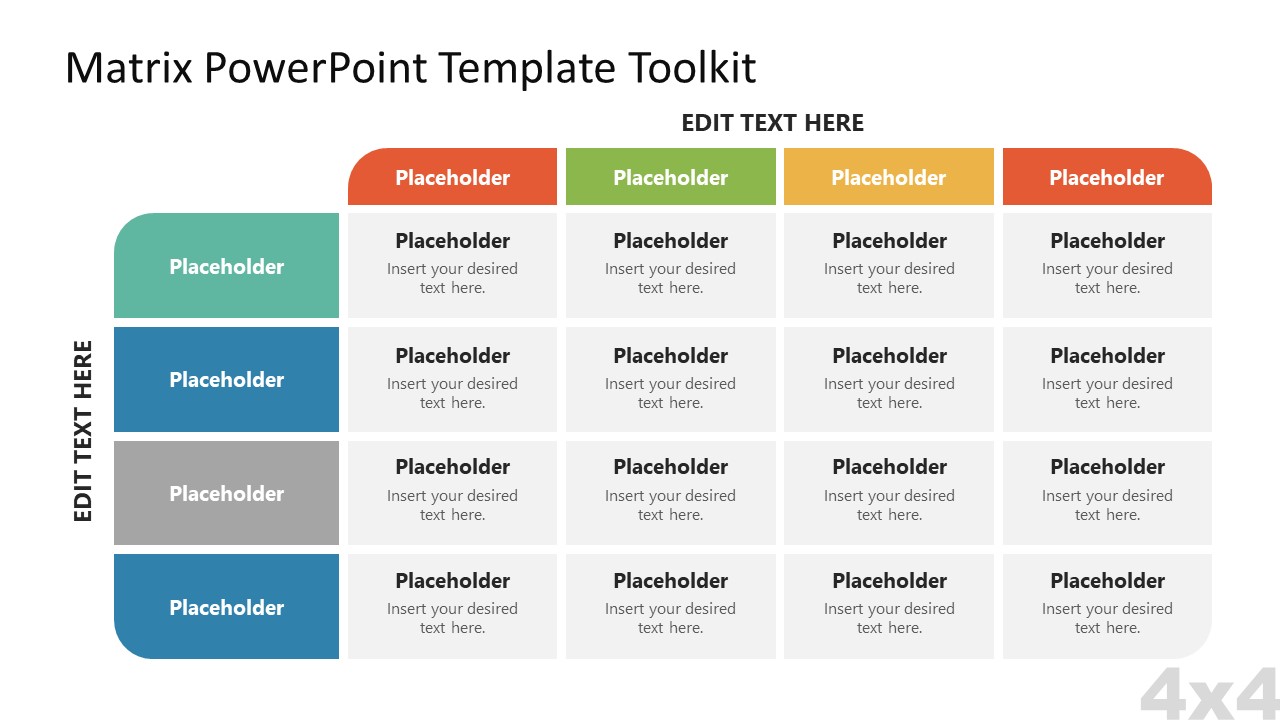
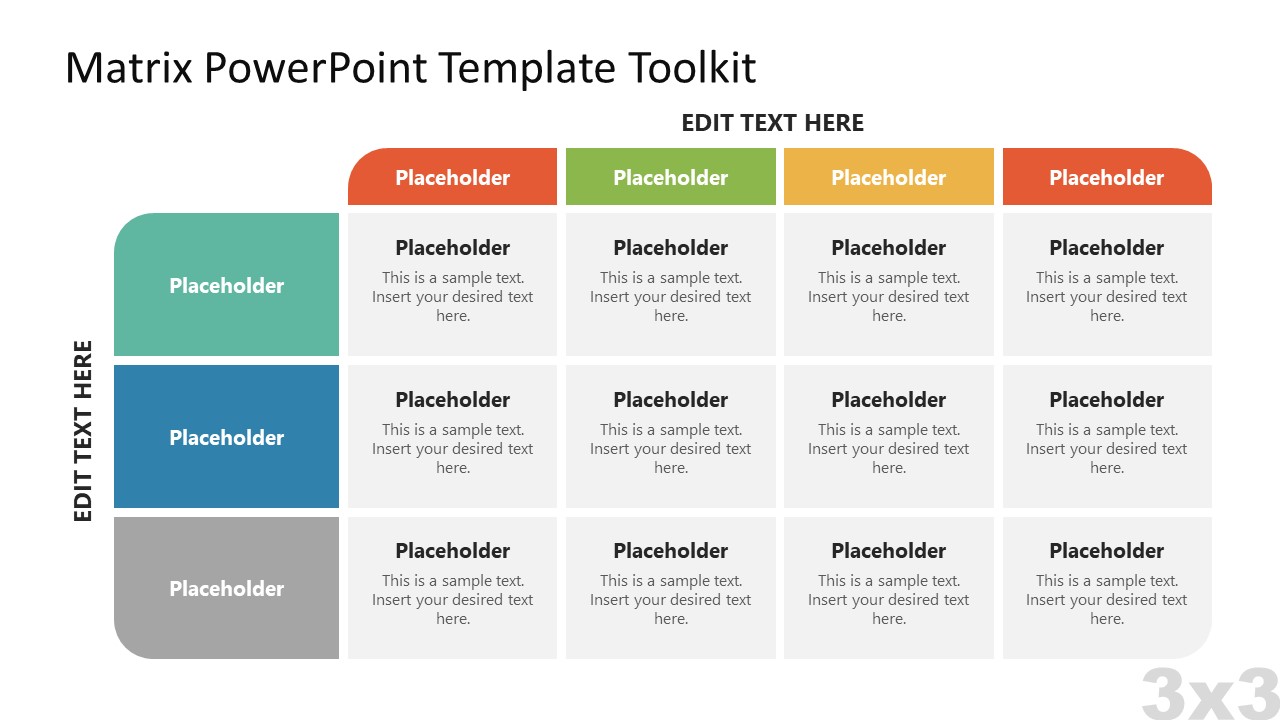
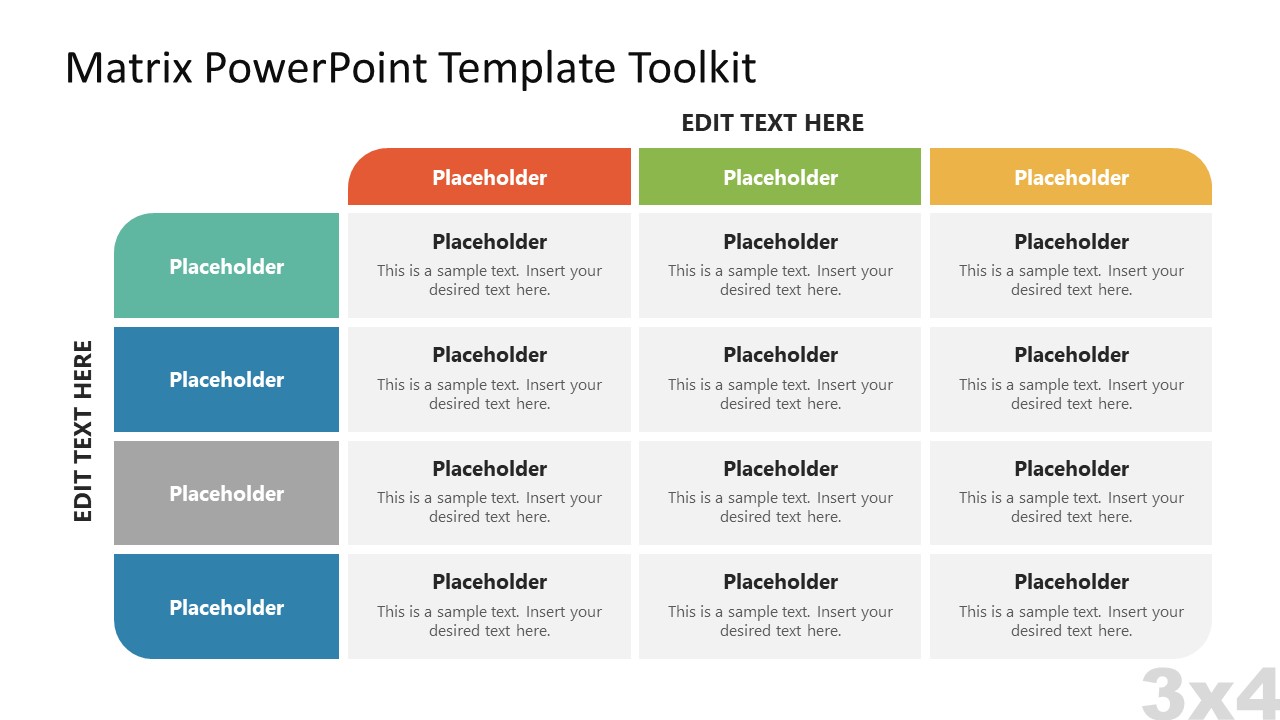
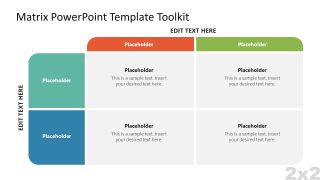
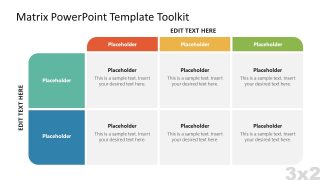
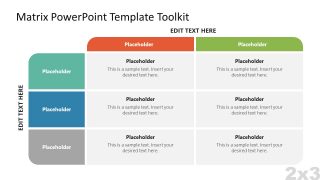
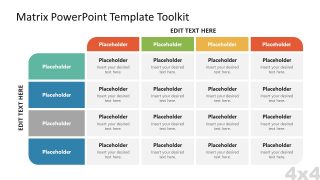
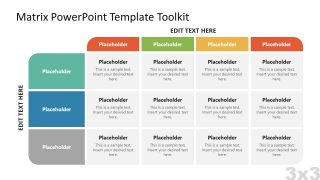
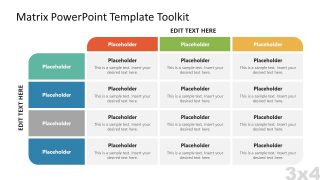
This Matrix PowerPoint Template Toolkit has seven template slides with matrix charts. Each chart has a grey background color in cells and text areas to add presentation values. The column and row title cells are colored and have a white font design to make the text readable. Along the two axes of the chart, users can also write down the considered parameters. This standard format is used on all the slides; however, each slide varies concerning the number of columns and rows.
The first slide has 3×3 matrices; the following slides carry 2×2, 3×2, and 2×3 matrix templates. These charts can help presenters showcase the data with limited entries. In contrast, the following slides have 4×4, 4×3, and 3×4 matrix templates to indicate more extensive data sets. The possible applications and use cases of these PowerPoint matrix charts are boundless. For instance, users can use the 4×3 chart to present the SWOT analysis of their competitors. The same 4×3 matrix can help educationists indicate their experiments’ results in a chemistry lab. So, download this impact effort matrix template and simplify your presentation with these ready-made slides.
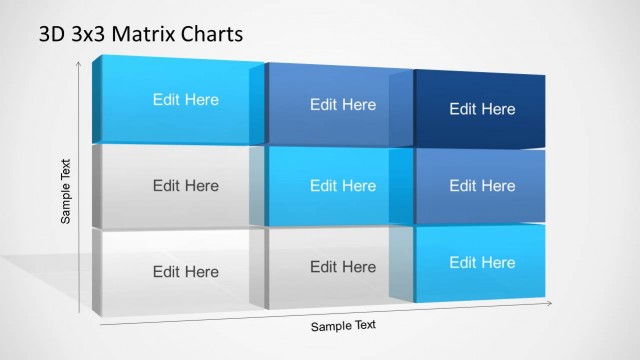
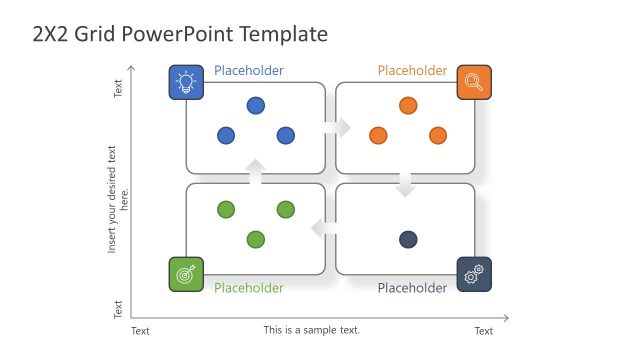
Alternatively, you can download other matrix templates for PowerPoint & Google Slides presentations, including 2×2 matrix PPT or 3×3 matrix templates.
