Los Angeles PowerPoint Template is a presentation template for Microsoft PowerPoint containing useful slide designs for presentations on California and Los Angeles city.
The sample slides offer maps, landscape and creative designs to help you create presentations that can instantly grab the attention of your audience. The given slides are highly editable and you can not only include your own text and images to enhance the sample slide designs but also change the look of the existing objects and clipart images, using PowerPoint options from the Ribbon Menu.
For more PowerPoint templates related to the United States, see our US Map Templates for PowerPoint.
What’s inside this template
Example presentation scenarios
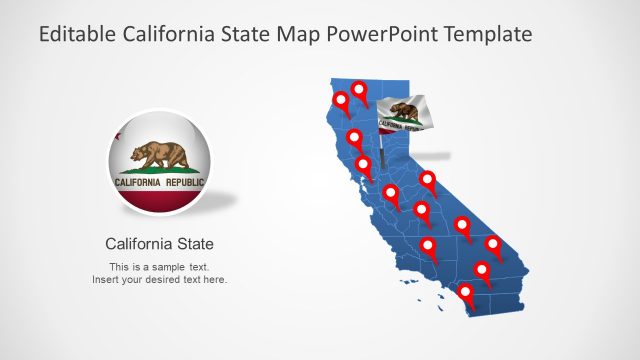
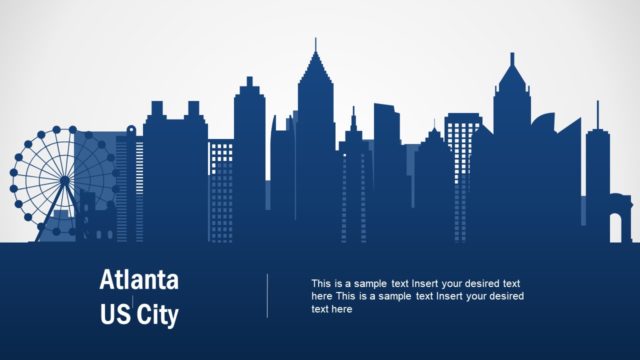
- A tourism manager can introduce a Los Angeles destination plan by opening with the skyline cover and then using the California pushpin map to show points of interest or target visitor areas.
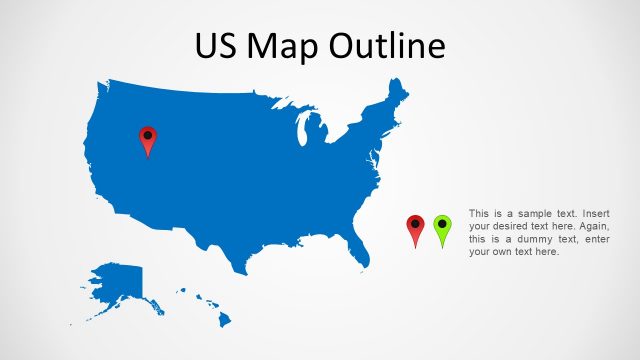
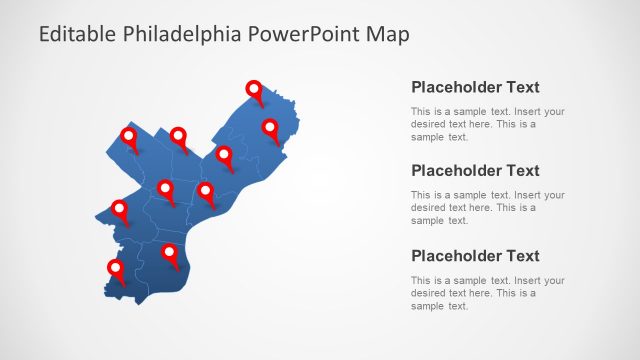
- A real estate team can present site context by using the California and United States map slide to show regional position, then the Los Angeles pin map to focus the discussion on the city.
- A business development presenter can explain market presence in Southern California with the labeled Los Angeles map and support the discussion with the grouped bar chart slide.
- A city planning or transportation presenter can use the marker map slides to show proposed locations, service zones, or project areas across California before summarizing with skyline-based text slides.
Features
- 100% editable presentation template
- Compatible with Microsoft PowerPoint and Google Slides
- Scalable vector shapes, icons and illustrations
- AI-Ready for Microsoft Copilot and Claude
- Instant access and download
Frequently asked questions
Q: How should a presenter organize a clear Los Angeles location story with this template?
A: Start with the skyline cover to establish the city theme, then move from broad geography to specific locations. Use the US map with California highlighted before the Los Angeles pin map so the audience understands scale. Close with the bar chart only after the map context is clear, so the data has a geographic reference.
Q: Who gets the most value from this Los Angeles and California map template?
A: This template fits presenters who need to explain where a Los Angeles initiative sits within California or the United States. Tourism teams, real estate groups, regional sales leaders, and planners can use the pushpin maps for locations, the skyline slides for city identity, and the bar chart for a small set of supporting figures.
Q: Why do the skyline and pushpin map visuals help the message?
A: The skyline creates immediate city recognition, while the pushpin maps give the audience a simple spatial anchor. That visual metaphor turns abstract location talk into a place-based story: first the city identity, then the California position, then marked areas of focus. The bar chart adds evidence without breaking the geographic frame.


Los Angeles PowerPoint Template
7-slide Los Angeles presentation template with California maps, city skyline, markers, and bar chart layouts
Los Angeles PowerPoint Template is a 7-slide city and map presentation template for location-based briefings about Los Angeles and California. It includes a skyline cover, Los Angeles building illustration, California pushpin maps, a US map with California highlighted, and a bar chart. Editable vector shapes support tourism, real estate, planning, or regional market presentations.

 Loading...
 Microsoft PowerPoint
 Microsoft Copilot
 Claude for PowerPoint
Other formats supported
Subscribe today and get immediate
access to download our PowerPoint templates.