Line with Doughnut Chart Template for PowerPoint
Bring about effective visuals with Line with Doughnut Chart Template for PowerPoint. The template is especially minimalistic and functional. The PowerPoint shapes create a photographic display of information. This helps the audience remember important ideas easily.
Ideal for a wide range of concepts, this PowerPoint template is reusable and efficient. It is best applicable in financial presentations. The slide designs can be used for economics and history reports because of the world map background. The graphs are also perfect for statistics and business pieces. It can be considered as generic with its fully customisable features.
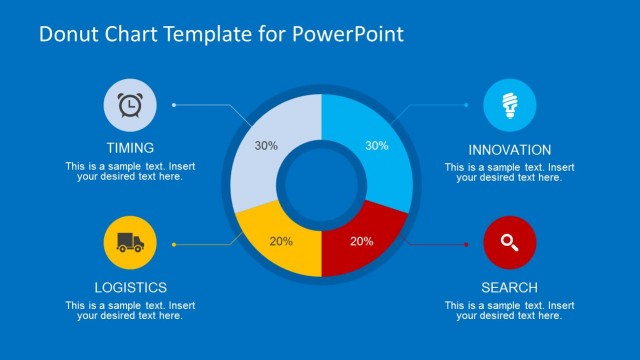
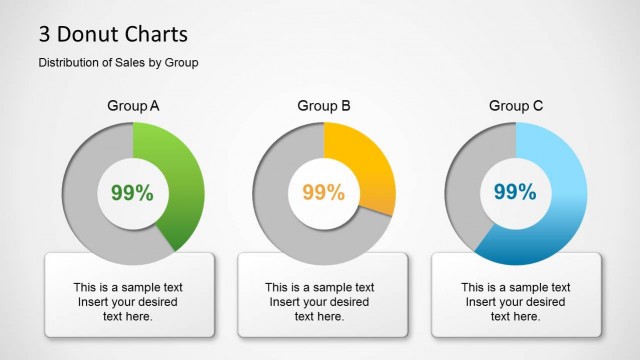
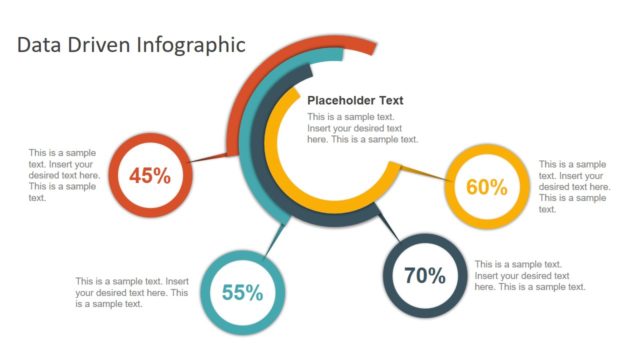
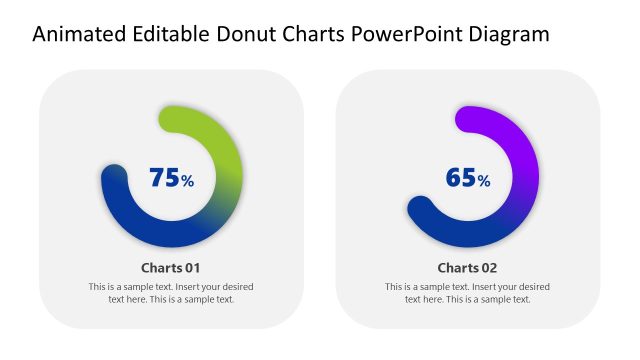
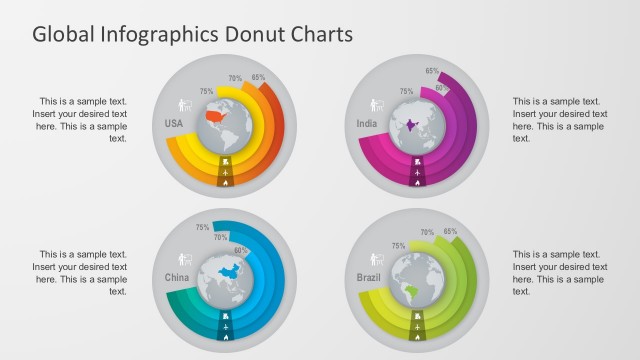
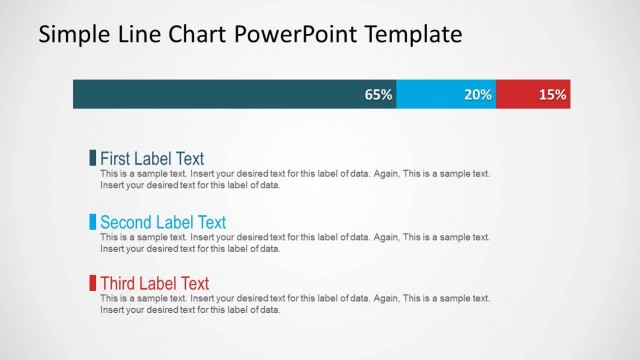
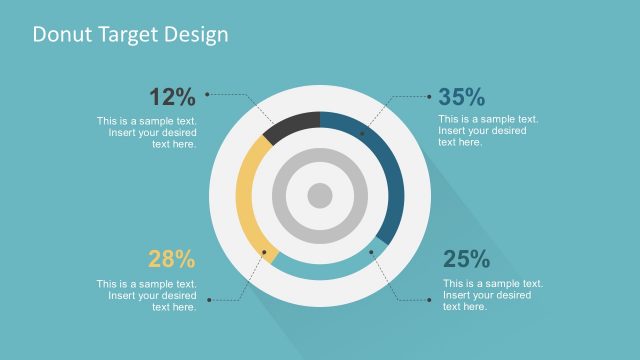
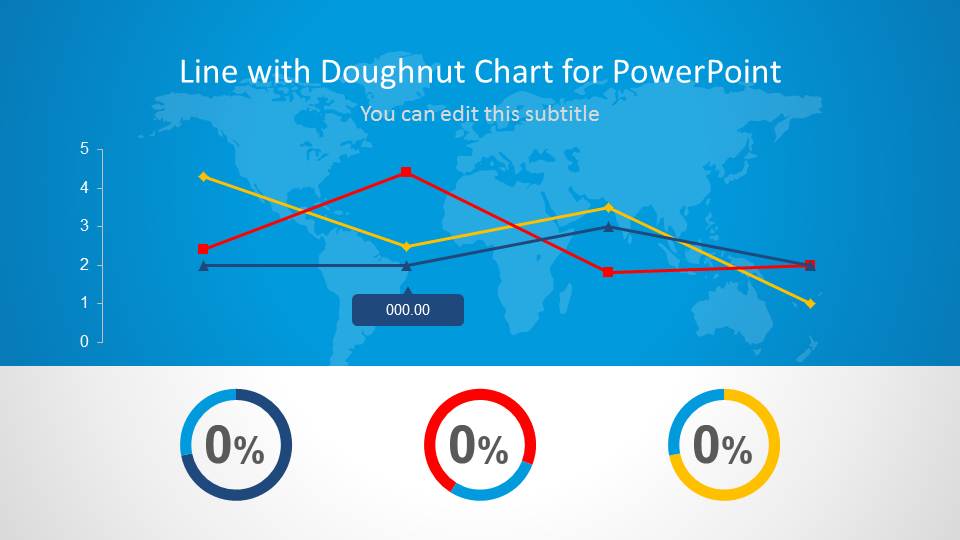
A line chart or line graph illustrates a series of quantitative information through points. Every point has a value. These points are traced and connected to each other, making a line along the way. This line represents a particular relationship between the points. Donut or circle charts, on the other hand, is divided into slices. Every arc or slice depicts a certain proportion of a numerical whole. These diagrams are designed to present data in a meaningful manner. They illustrate patterns and more comprehensive presentations compared to a textual report.
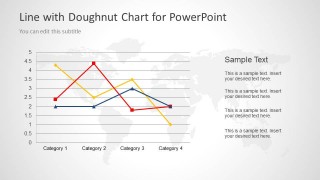
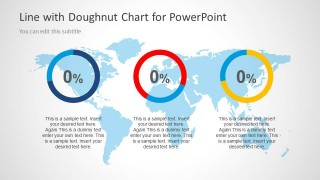
The entire PowerPoint template has a world map background. The first slide outlines the whole lecture. A line graph is featured on the middle of the slide. On the bottom part, the 3 donut charts are aligned horizontally. Each donut chart corresponds to one line in the line graph. It interprets the proportion of the values in the line to the total quantity of all variables. In the second slide, the line graph is given emphasis. The user can detail on the chart while on this slide. The third slide showcases the 3 donut charts and their quick descriptions. The layout allows very little text to keep the presenter from crowding it with information.
Attractive and smart, Line with Doughnut Chart Template for PowerPoint can surely impress global audiences. Numerous styles are downloadable from Data, Curve and Charts for PowerPoint section of SlideModel gallery. You can also download other data driven presentation templates, fully compatible with PowerPoint and Google Slides presentations.


You must be logged in to download this file.
DOWNLOAD- Category
- Data & Charts
- Rating


 Loading...
- Size
- 16x9
- Item ID
- 6097-01
- Colors
Subscribe today and get immediate
access to download our PowerPoint templates.