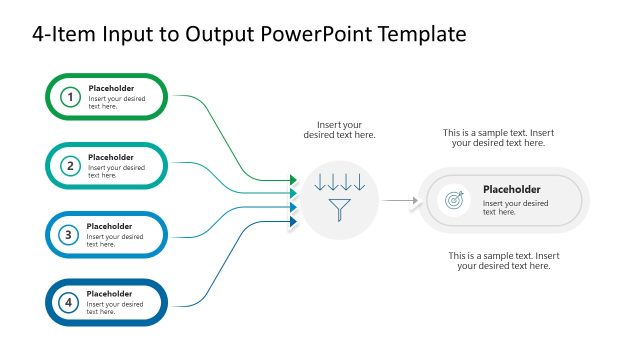
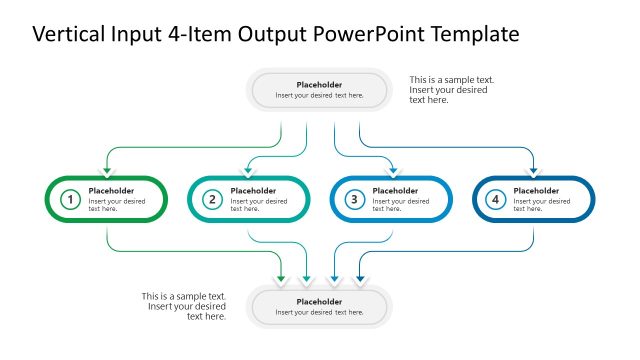
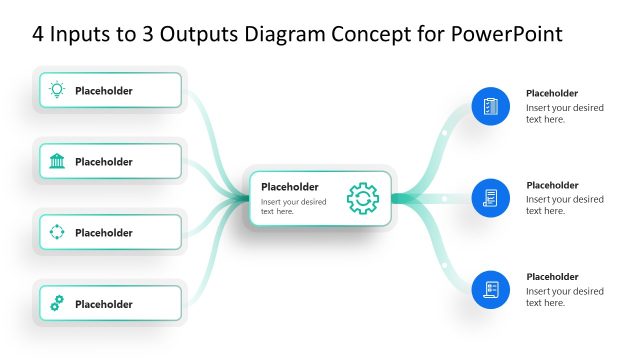
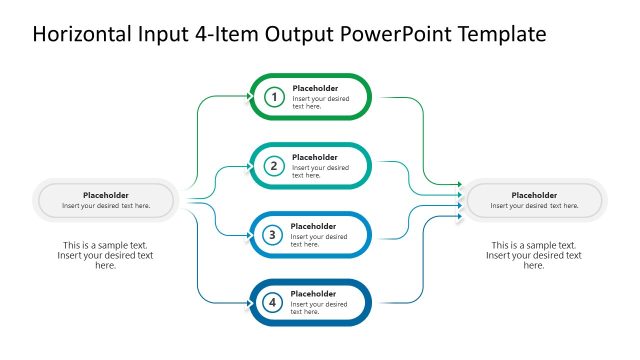
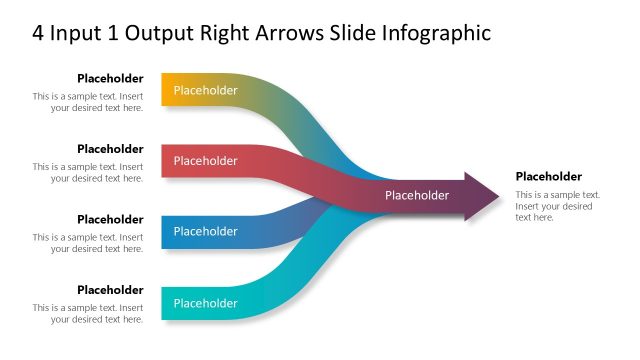
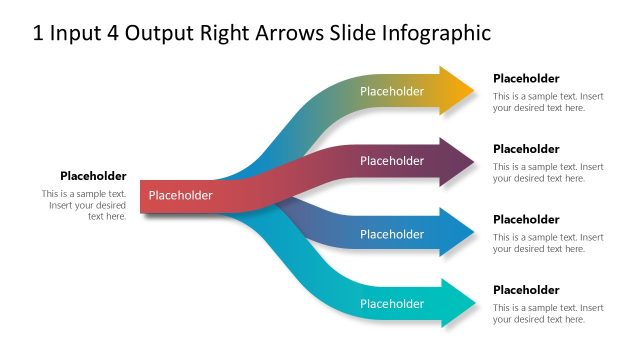
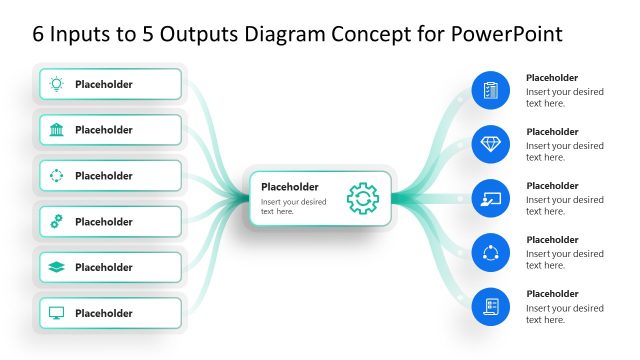
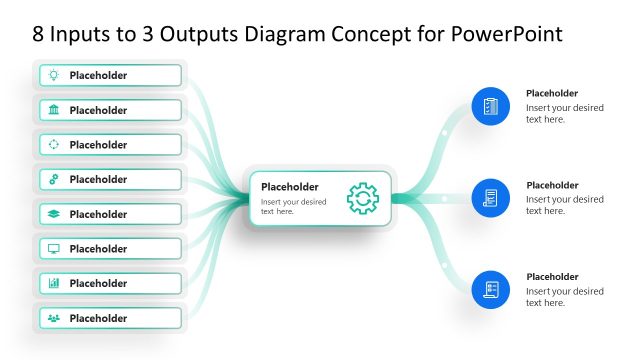
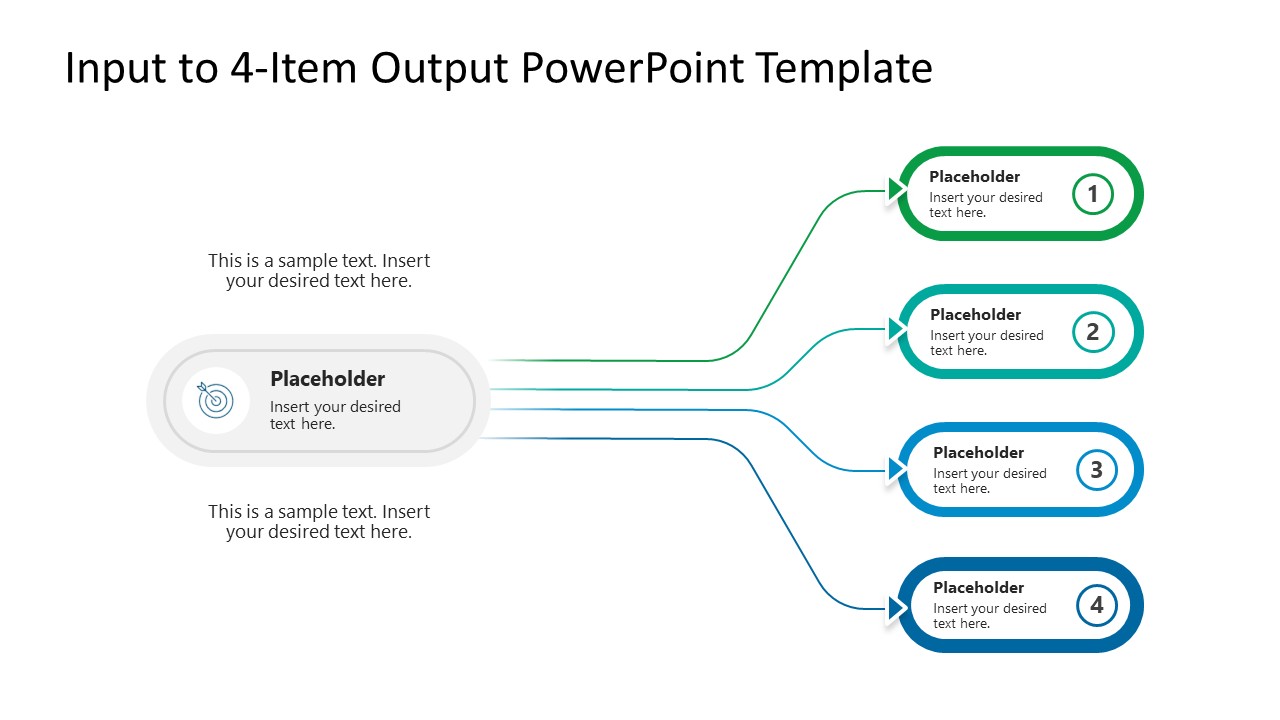
Present the impact of policy decisions on four different business departments with our Input to 4-Output PowerPoint Template during the change management presentation. System architects edit the input-output segments in the layout to visualize how one data source or API trigger feeds four separate application outputs. Business consultants explain the update in a single value proposition point, which then cascades into recommendations across product, sales, recruitment, and investor relations. In agentic workflows, AI engineers or orchestrators use the four-output diagram’s input to show how one event triggers a series of outputs. For instance, one lead entry activates an automation flow, an email, and two other sequences. You can also try this PPT template with Google Slides.
The Input to 4-Output PowerPoint Template comprises a single slide with an input-output diagram. The input item shows a small, curved rectangular shape with an icon and a text field. From which four arrows emerge, and each ends at one output item. The output item shows a small curved rectangular box with a gradient outline. Product managers use this diagram to present the four useful features of the product in a single response. They use numbered sections and text to visualize complete details. Moreover, our users can easily change the color scheme, icons, and fonts to perfectly match their needs. Download the input to the 4-output PPT diagram and discuss the impact of one action on four business components. Additionally, if you want to try other versions of the diagram, visit the input-output diagram templates collection and select the one that best matches your specific theme needs.
What’s inside this template
Example presentation scenarios
- A change management consultant can show how one policy decision affects four departments using the input box, branching arrows, and numbered output boxes.
- A system architect can explain how one API trigger or data source feeds four application outputs with the left-to-right flow structure.
- A product manager can present one core feature and describe four user benefits through the four numbered outcome sections.
- An AI workflow designer can map one lead entry or event into four downstream automation actions using the colored connector lines.
Features
- 100% editable presentation template
- Compatible with Microsoft PowerPoint and Google Slides
- 16:9 aspect ratio slides
- Scalable vector shapes, icons and illustrations
- AI-Ready for Microsoft Copilot and Claude
- Instant access and download
Frequently asked questions
Q: How should a presenter explain the diagram without making all four outputs feel equal if one is more important?
A: Start by defining the input in one short sentence, then introduce the four outputs in priority order. Use the numbered circles as the speaking sequence, and spend more time on the highest-value output. The two left-side callouts can frame why the input matters before the presenter moves across the arrows.
Q: Who is this template best suited for in a business or technical presentation?
A: It fits presenters who need to explain a one-to-many relationship in a single view, such as consultants, product managers, system architects, and automation teams. The layout works well when one decision, event, data source, or feature produces four concrete implications that the audience must compare quickly.
Q: Why does the one-input, four-output metaphor help the audience understand the message?
A: The diagram uses a clear cause-and-effect metaphor: one source on the left branches into four outcomes on the right. Curved arrows guide the eye, while numbered output boxes create an ordered reading path. This reduces ambiguity because the audience can see both the shared origin and the separate results.
Input to 4-Output PowerPoint Template
1-slide presentation template for input-output diagrams, workflow triggers, and four numbered outcomes
This 1-slide diagram template shows one input feeding four numbered outputs through curved arrows. It includes an input box with icon, four output pills, callout text areas, and color-coded connector lines for change, workflow, API, or business impact explanations in Microsoft PowerPoint and Google Slides.
- Category
- Diagrams
- Rating

 Loading...
- Aspect ratio
- 16:9
- Item ID
- 23712-01
- Colors
 Microsoft PowerPoint
  Microsoft Copilot
  Claude for PowerPoint
 Other formats supported
Subscribe today and get immediate
access to download our PowerPoint templates.