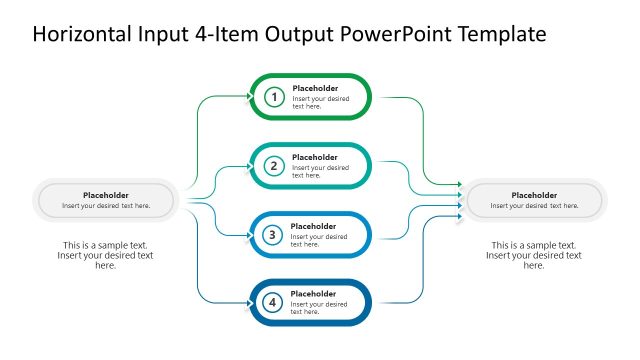
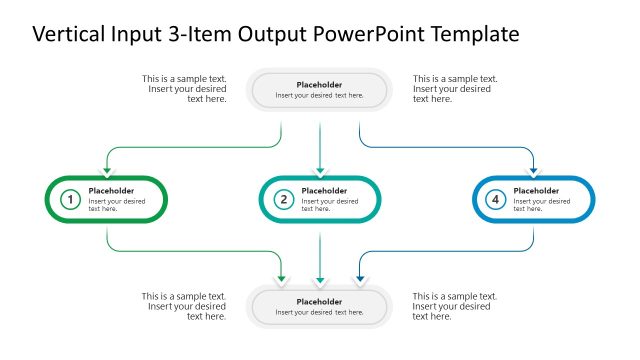
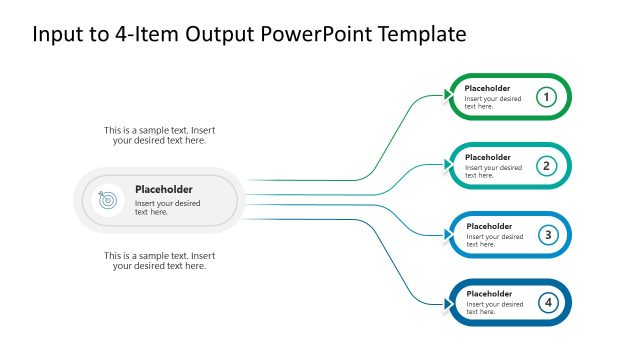
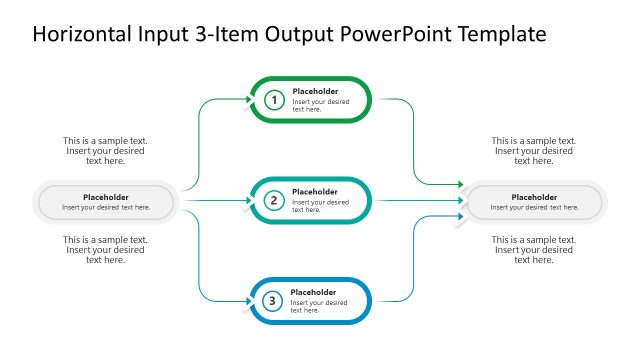
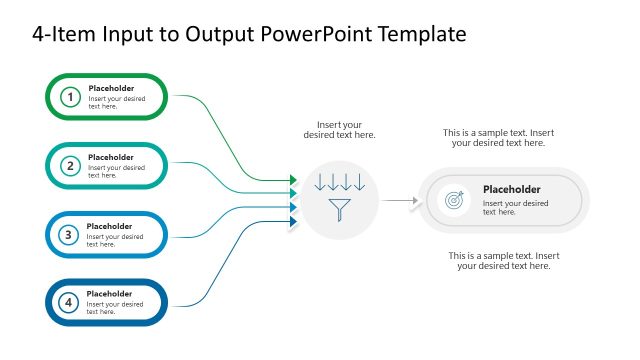
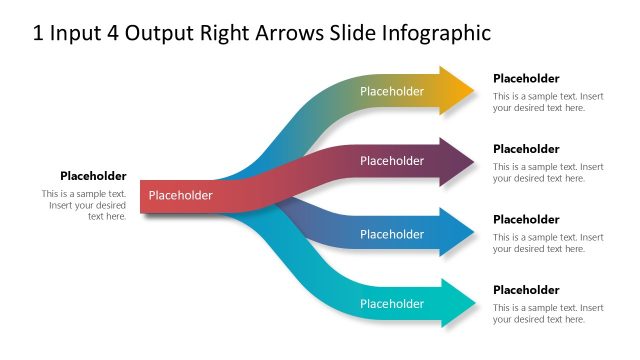
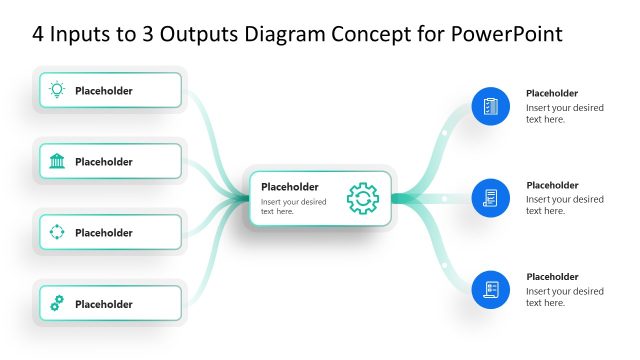
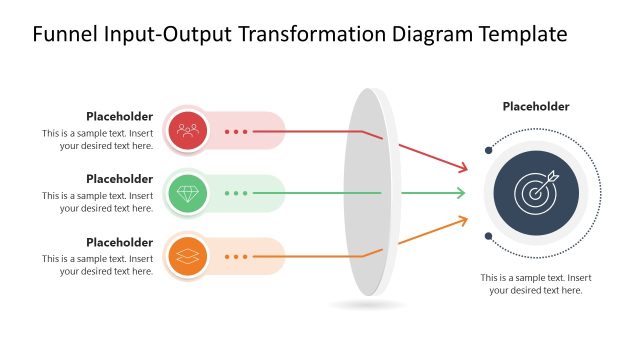
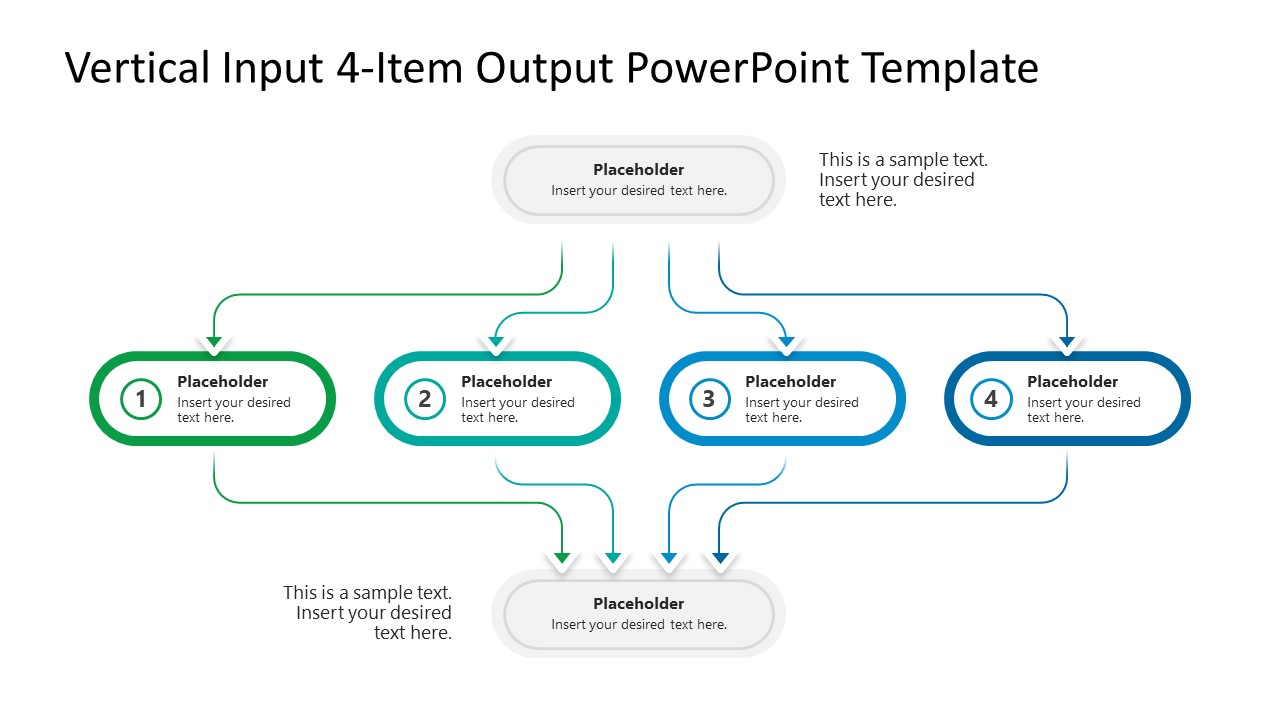
Download our professional and modern Vertical Input 4-Item Output PowerPoint Template to present processes that start with a single trigger, branch into multiple inputs that join to produce a combined effect. Input-output diagrams are useful in business presentations to illustrate how multiple causes produce a combined effect. Business consultants use input-output diagrams in either horizontal or vertical formats, depending on the presentation points. Operations directors discuss simultaneous departmental workflows that coordinate on a specific trigger. This PPT design comprises rounded shapes and a blue-green color scheme to visually separate distinct stages in the business process. The supply chain managers, in their client presentations, discuss how a single disruption can cause disruptions across multiple domains, creating a larger problem for the company. This PPT design features a unique approach in which one trigger creates four inputs that combine to generate a single outcome.
The Vertical Input 4-Item Output PowerPoint Template is a single-slide template, also compatible with Google Slides and other versions of Microsoft PowerPoint. You can change the shape types and outline colors to match your branding elements and theme. Financial controllers, in their board presentations or annual budget meetings, use the template to present how the total approved budget is divided across departments or teams. They can represent the combined output of those departments using a converging diagram at the bottom. The template diagram is ideal for showcasing the distribution logic and the impact scenario. In addition, we have an extensive collection of input-output PPT layouts to help our users choose the most suitable design for their concept presentation. Download the vertical input 4-item output template to clearly communicate the source to the output process.
What’s inside this template
Example presentation scenarios
- An operations director can use the four numbered item blocks to show how one event triggers parallel departmental workflows that converge into a final delivery outcome.
- A supply chain manager can present a disruption scenario by placing the root issue in the top placeholder and mapping four affected domains before showing the combined business impact at the bottom.
- A financial controller can explain budget distribution by using the top placeholder for the approved budget, the four branches for departments, and the output placeholder for the consolidated result.
- A consultant can use the curved arrows and numbered branches to help a client compare four contributing factors behind a shared operational result.
Features
- 100% editable presentation template
- Compatible with Microsoft PowerPoint and Google Slides
- 16:9 aspect ratio slides
- Scalable vector shapes, icons and illustrations
- AI-Ready for Microsoft Copilot and Claude
- Instant access and download
Frequently asked questions
Q: How should a presenter explain the flow without making the diagram feel crowded?
A: Start with the top trigger placeholder, then move left to right across the four numbered item blocks before summarizing the bottom output. Keep each item label short and use the side callouts only for context that clarifies the trigger or result. This keeps the audience focused on the cause-effect logic rather than reading full paragraphs.
Q: Who is this template best suited for in a business presentation?
A: This template works best for presenters who need to show how a single source creates four related actions, inputs, or impacts. Operations, finance, consulting, and supply chain teams can use it when the key message is convergence: separate workstreams or causes combine to produce one clear outcome.
Q: Why use a vertical input-output diagram instead of a list or table?
A: The vertical structure creates a visual metaphor for flow: one source feeds four branches, and those branches feed one outcome. Curved arrows make relationships visible, while the numbered rounded blocks help the audience compare the four inputs quickly. A list would name the items, but it would not show how they connect.
Vertical Input 4-Item Output PowerPoint Template
1-slide presentation template for vertical input-output process diagrams with arrows and four item branches
This 1-slide diagram template presents a vertical input-output process with a top trigger placeholder, four numbered item branches, curved connector arrows, and a bottom output placeholder. It is designed for business presenters explaining cause-effect logic, workflow distribution, or converging inputs in Microsoft PowerPoint and Google Slides.
- Category
- Diagrams
- Rating

 Loading...
- Aspect ratio
- 16:9
- Item ID
- 23707-01
- Colors
 Microsoft PowerPoint
  Microsoft Copilot
  Claude for PowerPoint
 Other formats supported
Subscribe today and get immediate
access to download our PowerPoint templates.