Discuss the project inputs that consolidate to produce useful deliverables at the end of the project cycle using our 8-Input to 3-Output Diagram Concept PowerPoint Template. The input-output diagram helps professionals explain how different components affect the process output. It is useful to present how different inputs in the industry are combined in specific ratios to generate the desired results. We have designed this template to showcase 8 inputs and 3 outputs. Users can easily change the number of inputs or outputs based on the information to present. Or they can check our ready-to-use versions of multiple input-output diagrams. Some of the key use cases of our template are:
- This template is also helpful for marketers, where they can showcase SEO, ads, email marketing, and social media as inputs to generate leads, conversions, or brand awareness as outputs.
- In educational or training sessions, the input-output diagram layout can help presenters showcase multiple learning factors, such as study, tools, and mentorship, and their contributions to skills development, earnings, and knowledge.
- You can also present a problem-solving framework using a multiple-input-to-output diagram.
- When presenting analytics, users can specify the data sources in the input section and display trends or patterns on the right side as output.
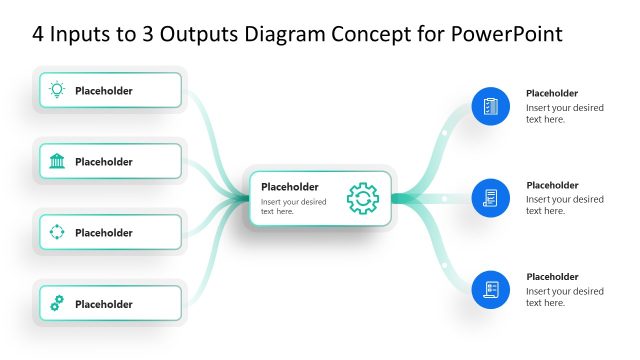
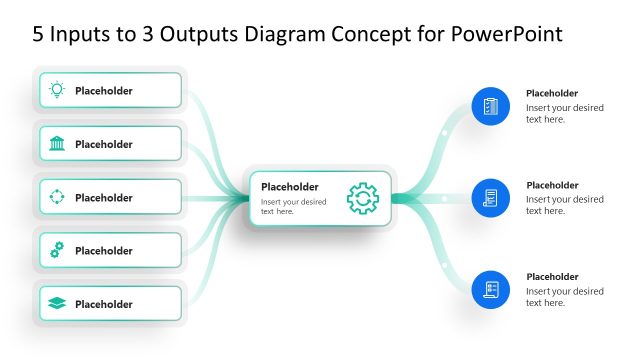
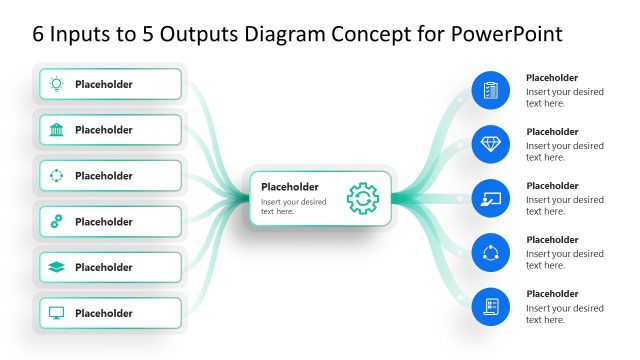
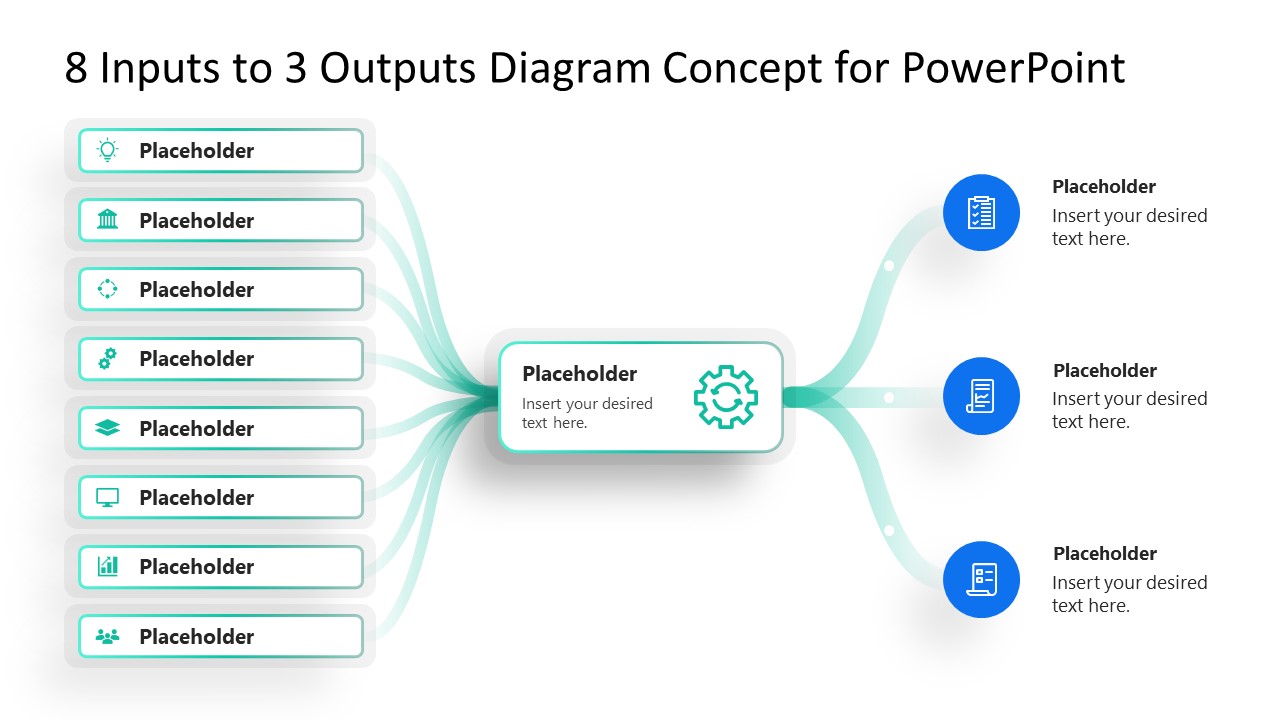
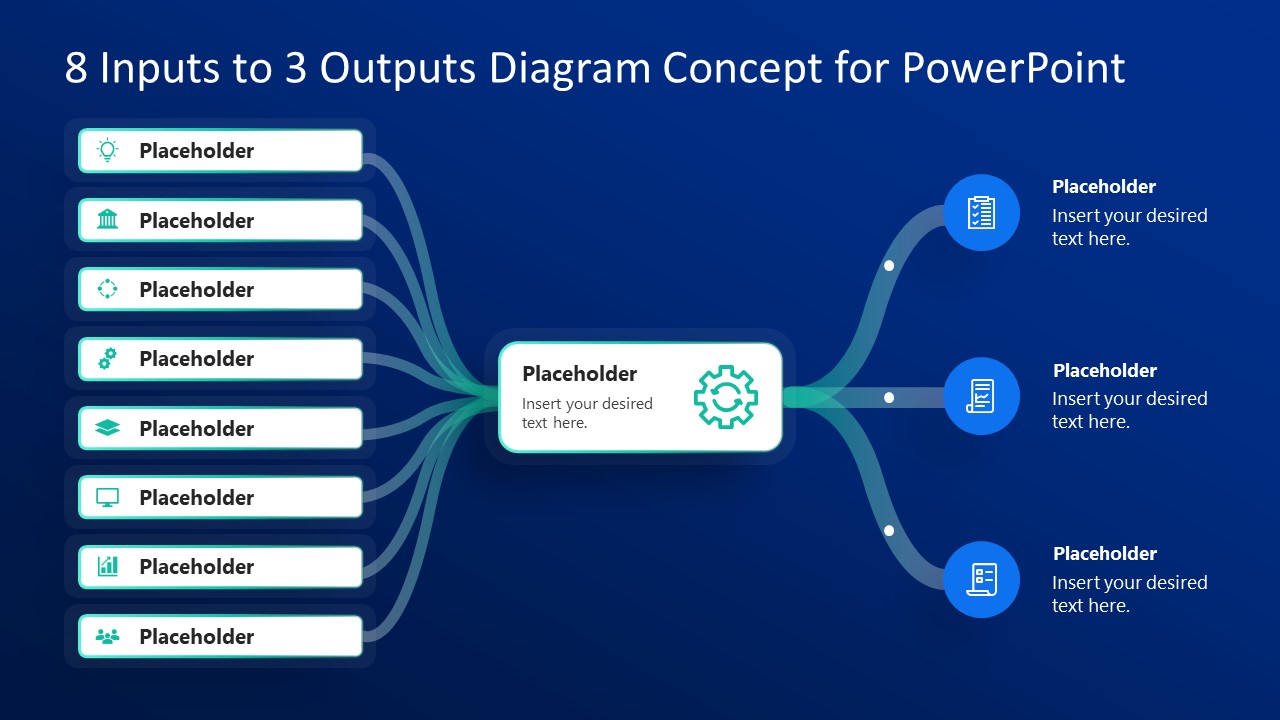
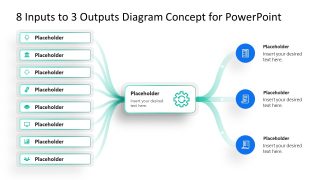
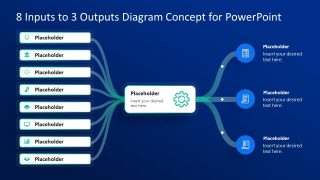
The 8-Input to 3-Output Diagram Concept PowerPoint Template has eight infographic blocks stacked vertically on the left side of the slide. They connect to the central block of consolidation with curved lines that converge at a single point. Next, curved lines meet with infographic circles to demonstrate the outputs. Users can modify icons or fonts and edit text to fully showcase their ideas or processes. Download the 8-input 3-output diagram template and discuss the workflows comprehensively.
What’s inside this template
Example presentation scenarios
- A project manager can use the eight input labels to list resources, constraints, and workstreams, then use the three output branches to present final deliverables.
- A marketing manager can show campaign inputs such as channels, content, and audience signals, then connect them to outcomes such as leads, conversions, or awareness.
- A trainer can explain how study habits, tools, mentorship, and practice flow through a learning process and produce skill, knowledge, and performance outcomes.
- A business analyst can list data sources on the left, describe the analysis step in the center, and present three findings or decision outputs on the right.
Features
- 100% editable presentation template
- Compatible with Microsoft PowerPoint and Google Slides
- 16:9 aspect ratio slides
- Scalable vector shapes, icons and illustrations
- AI-Ready for Microsoft Copilot and Claude
- Instant access and download
Frequently asked questions
Q: How should I present this diagram so the audience follows the logic?
A: Start on the left and group the eight inputs into meaningful categories before moving to the center block. Explain the consolidation step as the rule, process, or operating model that transforms those inputs. Then introduce the three outputs one at a time so the audience sees cause, mechanism, and result instead of a crowded list.
Q: Who is this input-output diagram best suited for?
A: This template fits presenters who need to simplify a many-to-few relationship for business, training, analytics, or operations audiences. It works well for project managers, consultants, marketers, and educators because the left stack captures contributing factors while the right-side output callouts keep the result set focused and easy to compare.
Q: Why does the converging-line design help communication?
A: The curved connectors act as a visual metaphor for consolidation: separate inputs flow into one process and then branch into defined outputs. That structure reduces ambiguity because the audience can see which elements feed the system, where transformation happens, and which results should be judged as the outcome.
8-Input to 3-Output Diagram Concept PowerPoint Template
2-slide presentation template for input-output diagrams, process consolidation, and outcome mapping
This 2-slide diagram template shows an 8-input to 3-output process in 16:9 format for Microsoft PowerPoint and Google Slides. Visible layouts include a vertical input stack, a central consolidation block, three curved output branches, and icon callouts for labeling components, deliverables, or results.
- Category
- Diagrams
- Rating

 Loading...
- Aspect ratio
- 16:9
- Item ID
- 23599-01
- Colors
 Microsoft PowerPoint
  Microsoft Copilot
  Claude for PowerPoint
 Other formats supported
Subscribe today and get immediate
access to download our PowerPoint templates.