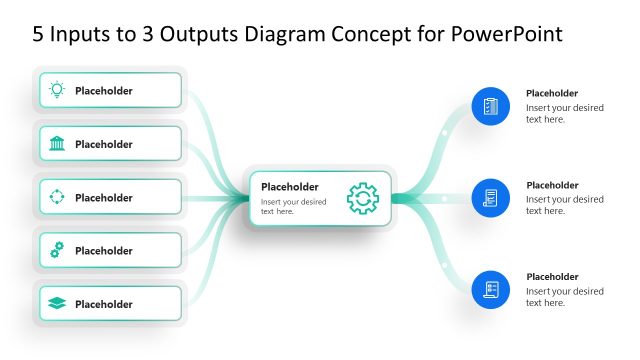
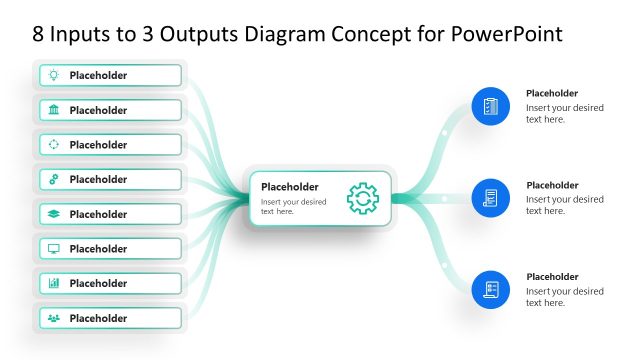
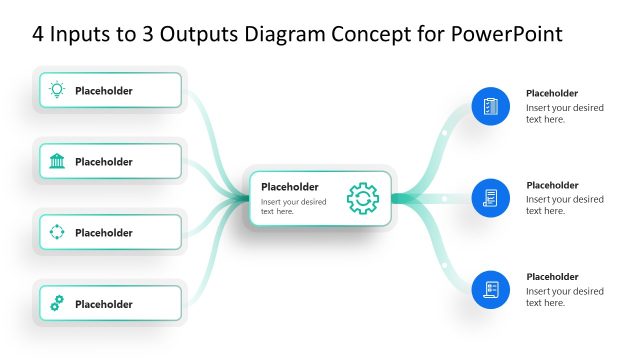
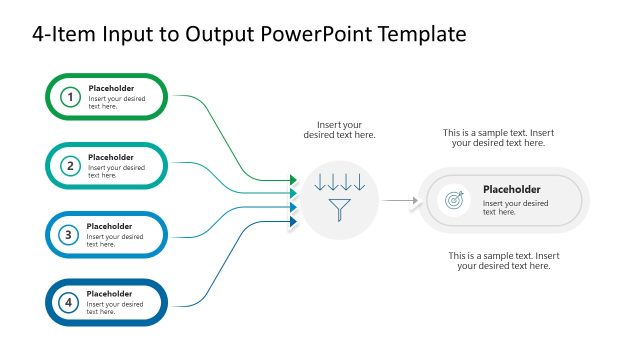
Present the multiple factors contributing to the project’s success and delivering tangible results or output with our 6-Input to 5-Output Diagram Concept PowerPoint Template. The input-output diagram shows how different elements combine and generate different outputs. This input-output layout is useful for visualizing the project requirements as inputs and the deliverables as outputs. You can also edit our template to present a digital marketing strategy map in their business meetings. Professionals can also use this template to discuss various problems and their related solutions. In product development, users can mention the different stages that lead to the final deliverables.
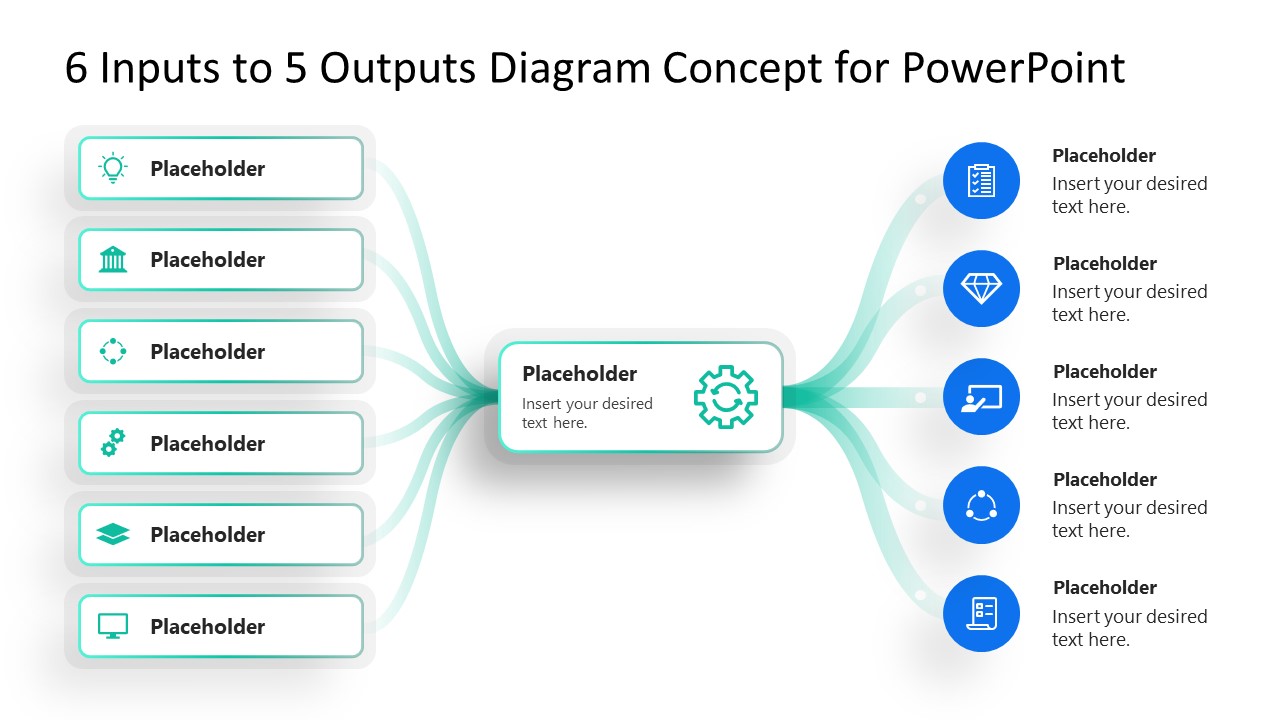
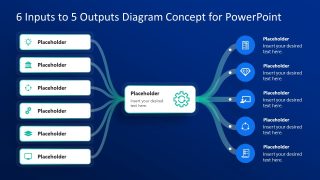
The 6-Input to 5-Output Diagram Concept PowerPoint Template features six horizontal blocks stacked on the left. Curved lines emerge from each of them and converge into the central block. From this central shape, five similar lines extend and connect to five circular infographic icons, which are designed to display the outputs. All the blocks contain an infographic icon to visually display the content and placeholder text for the title. In the outputs section, we have provided a text segment for each segment so that professionals can clearly outline the information. The first slide has a white background, while the second slide has a dark blue background with teal text over it.
Users can change text and background colors, format shapes, and modify fonts to perfectly match the presentation to their theme. They can also add more elements to the input section or output section based on the points of discussion. Additionally, you can check other versions of our input-output templates and select the most suitable one for your business sessions. Download it now!
What’s inside this template
Example presentation scenarios
- A project manager can use the input blocks and five output callouts to explain how requirements, resources, risks, and decisions translate into project deliverables.
- A business consultant can present a strategy map by placing strategic drivers on the left, the operating model in the center, and measurable outcomes on the right.
- A product manager can show how research, customer needs, technical constraints, and team activities feed a product development process and create final release outputs.
- An operations leader can use the dark-background version to brief executives on process inputs, the controlling workflow, and expected operational results.
Features
- 100% editable presentation template
- Compatible with Microsoft PowerPoint and Google Slides
- 16:9 aspect ratio slides
- Scalable vector shapes, icons and illustrations
- AI-Ready for Microsoft Copilot and Claude
- Instant access and download
Frequently asked questions
Q: How should a presenter organize content in this input-output diagram?
A: Place only the strongest six drivers on the left and keep each input label short. Use the central block for the process, initiative, or decision logic that transforms those inputs. On the right, write output labels as outcomes rather than activities, so the audience can quickly see the connection between effort and result.
Q: Who is this template best suited for in a business presentation?
A: This template fits presenters who need to explain cause, contribution, and outcome without building a full process map. Project managers, consultants, product leads, and operations teams can use it when the message is, 'these factors feed one mechanism and create these results,' especially in planning, review, or stakeholder alignment meetings.
Q: Why does the center block and curved flow design make the message clearer?
A: The visual metaphor treats the center block as a transformation point, so the audience reads the slide from inputs to process to outputs. The curved connectors reduce the need for long explanations because they show contribution and direction at a glance, while the circular output icons separate final results from input conditions.

6-Input to 5-Output Diagram Concept PowerPoint Template
2-slide input-output diagram presentation template for mapping project inputs, central process logic, and deliverables
This 2-slide 16:9 diagram template presents six inputs feeding a central process block and five output nodes. It includes light and dark background versions, editable icon blocks, curved connector flows, and output callouts for project requirements, deliverables, strategy mapping, or problem-solution explanations in Microsoft PowerPoint and Google Slides.
- Category
- Diagrams
- Rating

 Loading...
- Aspect ratio
- 16:9
- Item ID
- 23600-01
- Colors
 Microsoft PowerPoint
  Microsoft Copilot
  Claude for PowerPoint
 Other formats supported
Subscribe today and get immediate
access to download our PowerPoint templates.