Hand-drawn Venn Diagram PowerPoint Template
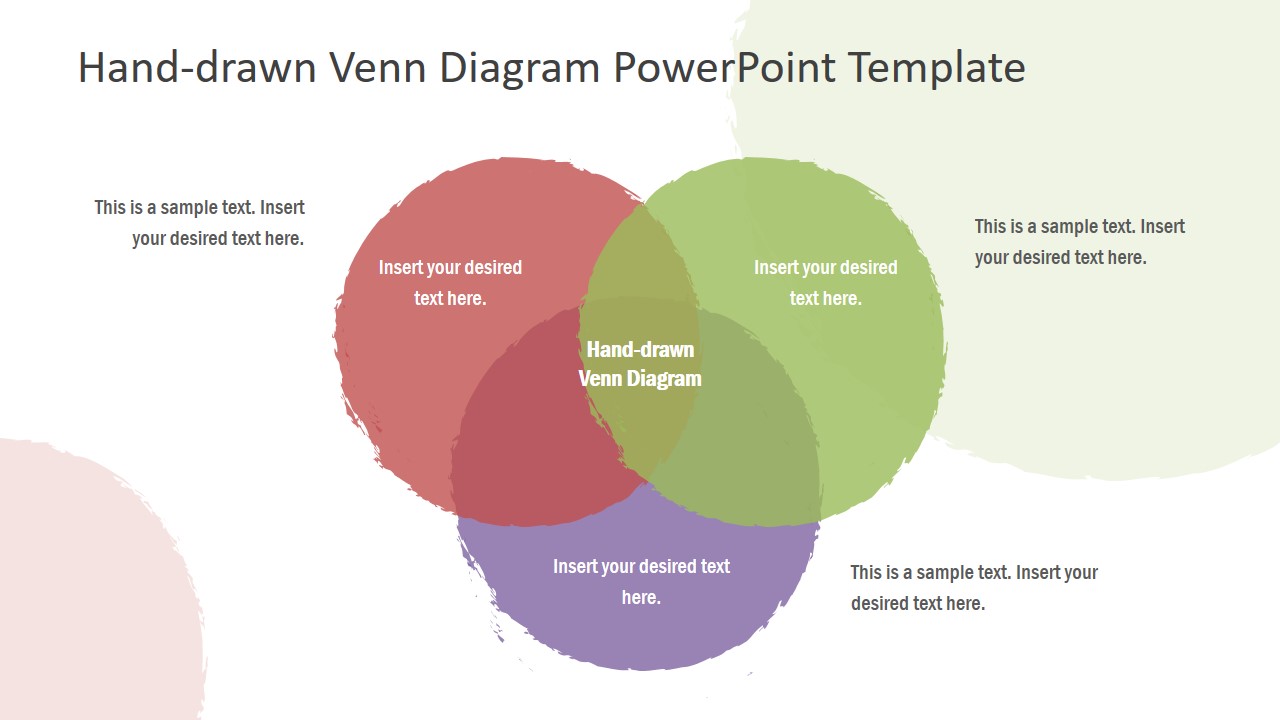
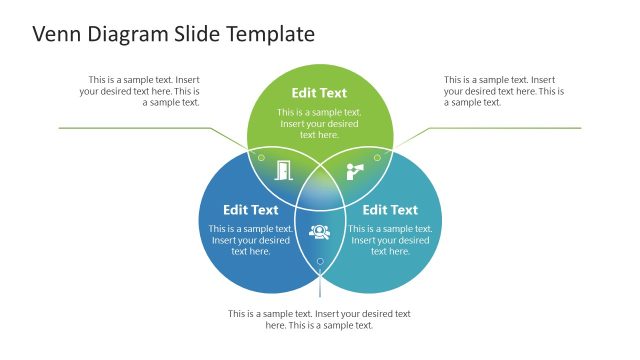
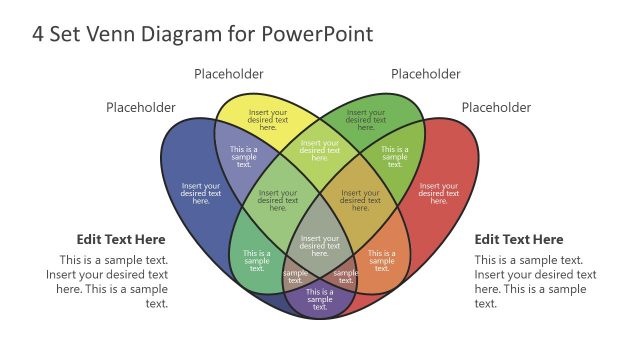
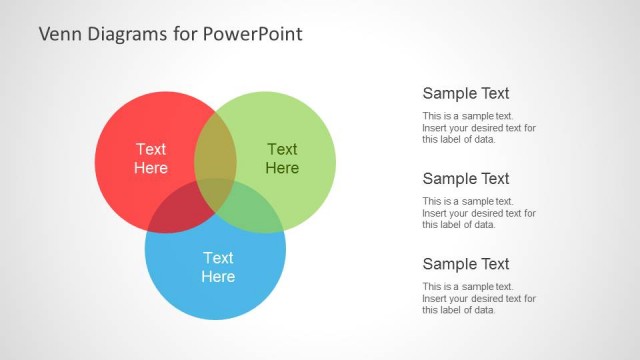
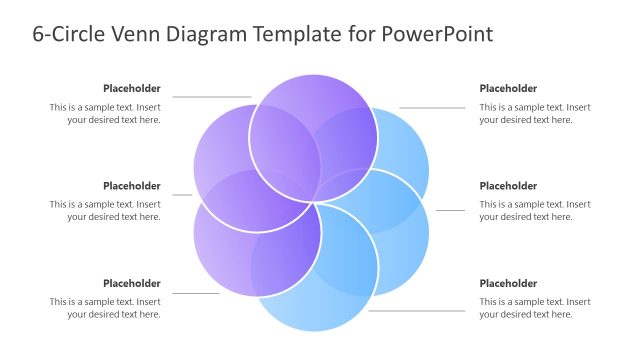
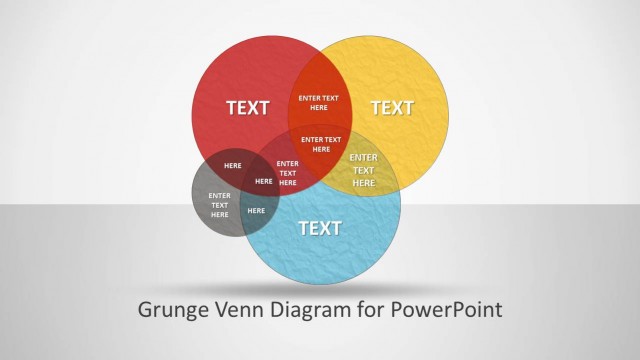
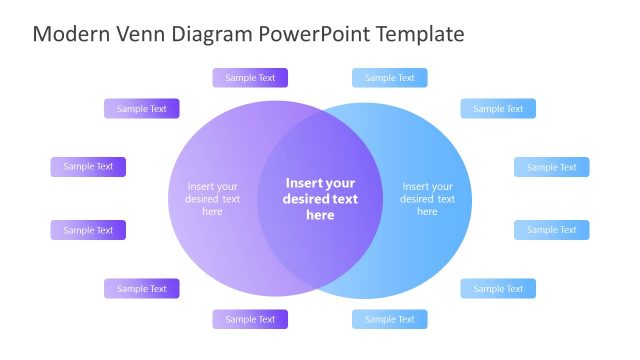
The Hand-drawn Venn Diagram PowerPoint Template presents an appealing brush storks design to highlight data dependencies. It is a diagram that illustrates logical relation between three sets of entities. This diagram is often used to demonstrate the similarities between different groups. Therefore, it is a quick and easy visual for statistical analysis presentations. The Venn diagram displays data units as points in circular region where overlapping of curves represent similarities. Therefore, the diagram can display all logical relations between finite numbers of sets.
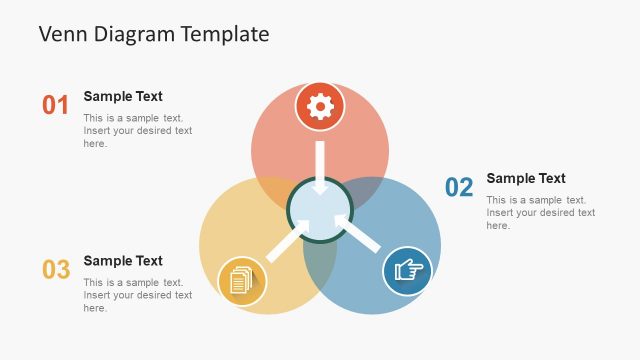
The Hand-drawn Venn Diagram PowerPoint Template originally shows three circular segments and their intersections. These three segments include text placeholders to represent data value, but users can add shapes like circles, stars, or number instead. Furthermore, users can customize elements of slide design in this editable PowerPoint template. Such as changing semi-transparent shape color, adding effects or gradient, customizing text font and more. The users can also add more circular segments as multi-variable Venn diagram. Alternatively, download infogrpahic 4 segment Venn diagram template Ikigai PowerPoint.
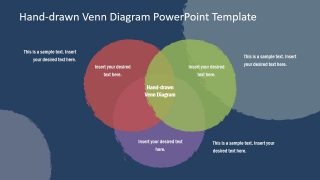
The PowerPoint template of Venn diagram is useful when dealing with probability statistics. The design will impress audience with its simple layout. This template of hand-drawn Venn diagram contains 2 slides of different backgrounds. Therefore, users can select desired background or further modify according to an existing presentation.
