Slide 15 of 18 from Market Share Diagrams for PowerPoint
6168-01-market-share-diagrams-15
Market Share Analysis Diagram for Presentations
- Diagram
- Circular Cycle
- Strategic Analysis Slide
- 16:9
- 100% Editable
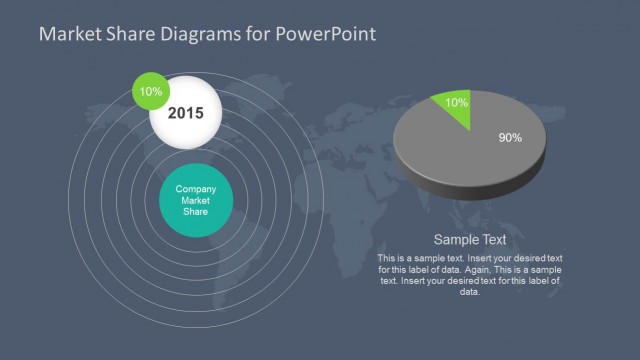
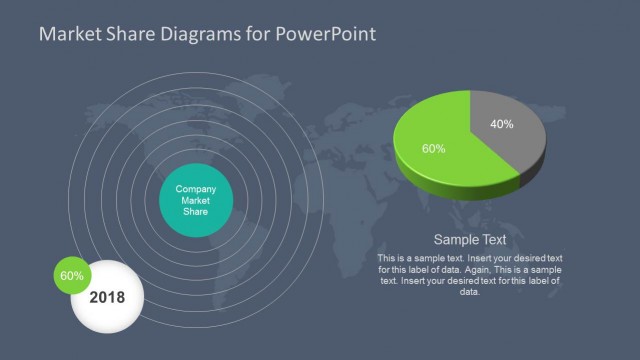
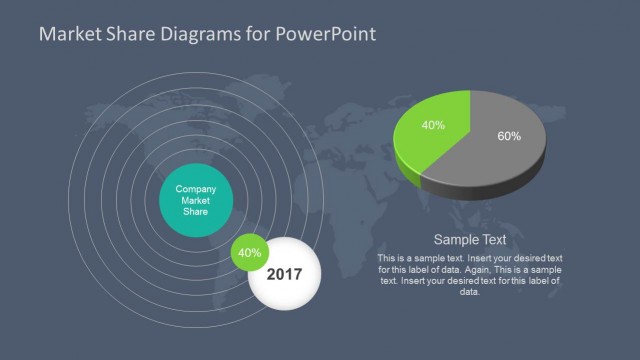
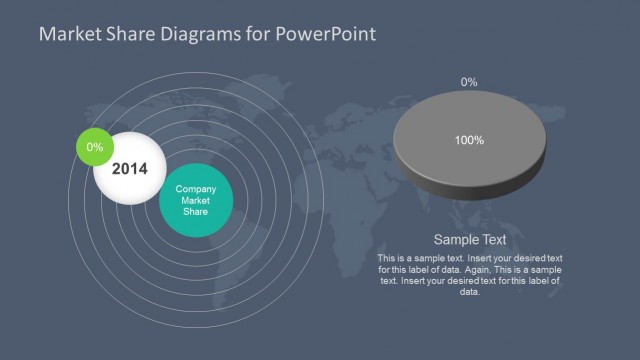
The Market Share Analysis Diagram from the Market Share Diagrams for PowerPoint template offers a clear visual tool for strategic analysis in business presentations. Featuring editable shapes and vector icons, this slide layout combines a world map background with concentric circles and a 3D pie chart to effectively display competitive market share data. It is well suited for corporate presentations and pitch deck templates focused on market positioning and business strategy discussions.
What’s on This Slide
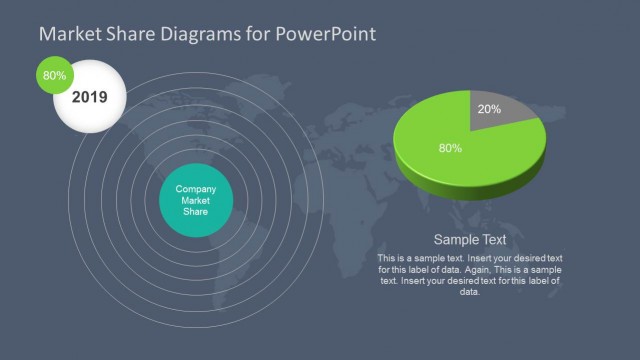
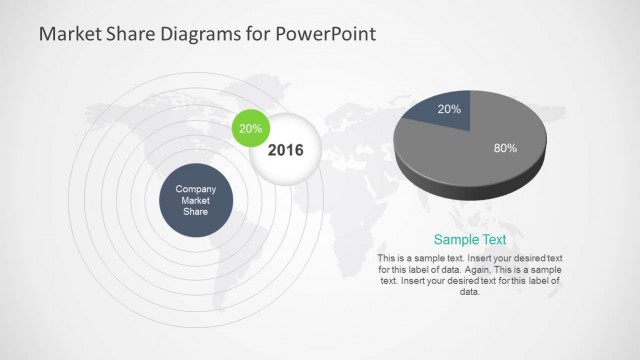
The layout features a world map background with concentric circles representing market share. A large green circle labeled 'Company Market Share' is positioned centrally, with a smaller white circle indicating the year '2016' and a percentage value of '20%'. To the right, a 3D pie chart displays '20%' and '80%' segments, with a text placeholder below for additional information. The overall composition balances the diagram and chart, emphasizing the market share data visually. Text placeholders are aligned to maintain a clear hierarchy.
How to Use It
This layout serves as a market share analysis tool, ideal for presenting competitive positioning within a global context. It fits well after introductory slides that outline market trends or challenges, providing a visual representation of a company's market share. This structure is useful in business meetings, marketing presentations, and strategic planning sessions, where clear data visualization is essential for decision-making.
Text Placeholders & Capacity
Keep your copy within these limits so it fits without resizing. Body slots can accommodate roughly 20-25 words each.
| Placeholder | Count | Max characters (approx.) |
|---|---|---|
| Slide title | 1 | 40 |
| Item heading | 1 | 20 |
| Item body | 1 | 100 |
| Chart title | 1 | 20 |
| Body paragraph | 1 | 200 |
Slide Keywords
Download unlimited PowerPoint templates, charts and graphics for your presentations with our annual plan.
DOWNLOADReturn to Market Share Diagrams for PowerPoint.