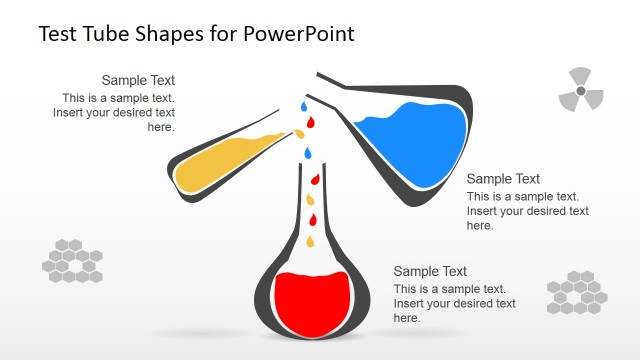
Flat Test Tube Infographic PowerPoint Shapes –Effectively deliver an ingenious medical idea using the Flat Test Tube Infographic PowerPoint Shapes. Infographic designs are created as a better means of communicating ideas to a wider range of audience. It’s an intriguing mode of advertisement that can easily spark interest for complex campaigns. Generally, this type of presentation tells the whole story of a theory, campaign and any other business or non-business ideas. Another characteristic of the infographics is its ability to deliver messages without much words or texts. The story or messages it represents relies heavily in familiar yet meaningful illustrations. In a presentation using infographics, the statements given by the speaker only adds more sense and enlightenment to the illustrations.
This PowerPoint shapes are also a great addition in ready-made templates. The objects found in this design are reusable, editable and can be inserted to other presentations. These shapes are all distinctively created by our own graphic designers exclusively for SlideModel. Edit and customize these shapes according to your own creativity. Its colors, sizes and texts are all fully editable while maintaining its excellent image quality. These limited designs, complemented with your amazing ideas will be a guaranteed trademark for all your presentations. The template can be used as it is or combined with a variety of other shapes and images in our PowerPoint Shape gallery.
The Flat Tube Infograhic PowerPoint Shapes template is perfect for presentations about medical equipments, marketing plans for drug companies as well as for medical conventions. The medical industry’s needs greater presentations and visual impact. Generally Presenters in this industry are not tech savy. PowerPoint Templates will help non professional designers to create quickly , modern professional templates. Medicine is global, in response to this, a great template for business presentation designed that is to use minimal and simple wording will be a great help in reaching out to international markets.
What’s inside this template
Example presentation scenarios
- A medical presenter can introduce a new clinical concept by using the segmented test tube callouts to label ingredients, phases, or evidence points.
- A pharmaceutical marketer can explain a campaign or product idea by using the central test tube and upward arrows to show growth, interest, or adoption.
- A science educator can teach a lab process by mapping steps to the colored liquid bands and connector labels on the tube.
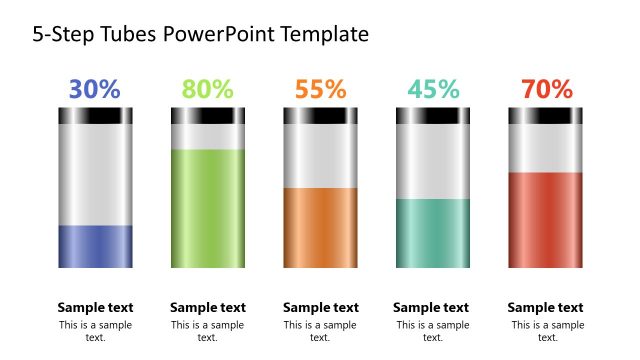
- A research team can report experiment status by using the percentage scale slide to frame progress, completion level, or relative intensity.
Features
- 100% editable presentation template
- Compatible with Microsoft PowerPoint and Google Slides
- 16:9 aspect ratio slides
- Scalable vector shapes, icons and illustrations
- AI-Ready for Microsoft Copilot and Claude
- Instant access and download
Frequently asked questions
Q: How should I structure a short science explanation with this template?
A: Start with the central test tube slide to state the main idea, then use the percentage scale to show progress or intensity. Follow with the segmented callout slide to explain parts of the concept. Keep each label short, because the visual metaphor should carry the explanation while the presenter adds detail verbally.
Q: Who is this test tube diagram template best suited for?
A: It fits presenters who need to make scientific or medical ideas easier to scan, such as lab teams, pharmaceutical marketers, healthcare consultants, and science educators. The format is strongest when the message can be framed as stages, levels, ingredients, or progress rather than dense research findings.
Q: Why does the test tube metaphor work for these slides?
A: The test tube immediately signals laboratory, chemistry, and medical context, so the audience understands the domain before reading the text. Fill levels, bubbles, arrows, and segmented bands turn abstract ideas into measurable or staged visuals. This makes the diagram useful for explaining growth, experiment phases, formula components, or campaign progress.


Flat Test Tube Infographic PowerPoint Diagram
4-slide presentation template for test tube infographics, percentage scale visuals, and lab callouts
Flat Test Tube Infographic PowerPoint Diagram is a 4-slide diagram template for Microsoft PowerPoint and Google Slides. It includes a central test tube infographic, a percentage scale with fill level, a segmented tube with callouts, and a tall fill-level tube for science, medical, lab, or chemistry presentations.
- Category
- Diagrams
- Rating

 Loading...
- Aspect ratio
- 16:9, 4:3
- Item ID
- 6574-03
- Colors
 Microsoft PowerPoint
 Microsoft Copilot
 Claude for PowerPoint
Other formats supported
Subscribe today and get immediate
access to download our PowerPoint templates.