Test Tube Diagram Template for PowerPoint
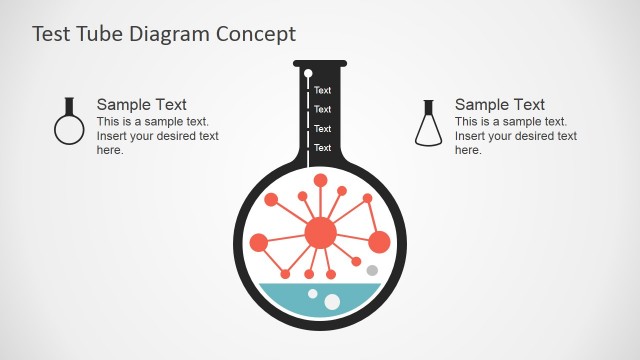
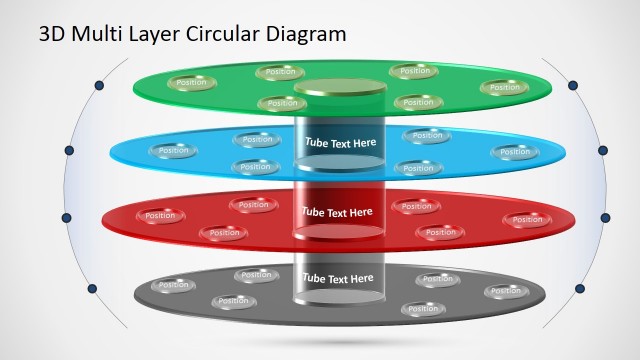
Test Tube Diagram Template for PowerPoint is a presentation design containing a simple but useful test tube shape with flat style. You can use the test tube shape slides to prepare presentations with a multi-level diagrams.
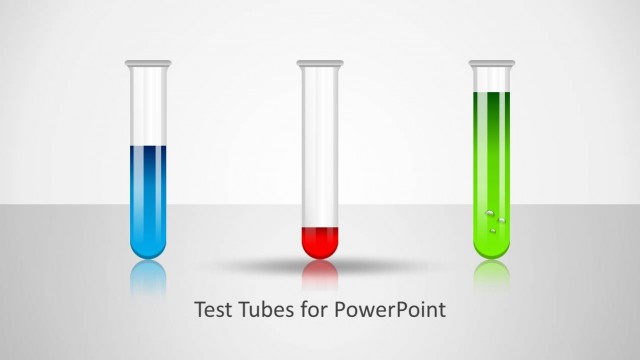
First interaction with test tubes normally takes place at school. Test tubes are used to carry out different experiments. Different ingredients are mixed in and the results come out in form of gas emission or precipitation. Test Tube Diagram Template for PowerPoint can be an ideal choice for anyone looking to explain scientific phenomenon.
School teachers make use of many illustrations and other teaching aids to help students understand science in a better way. One of them is the use of presentations for their lectures. Using a proper PowerPoint template helps catching attention of the audience, students are more attracted to animations than any other visual collateral.
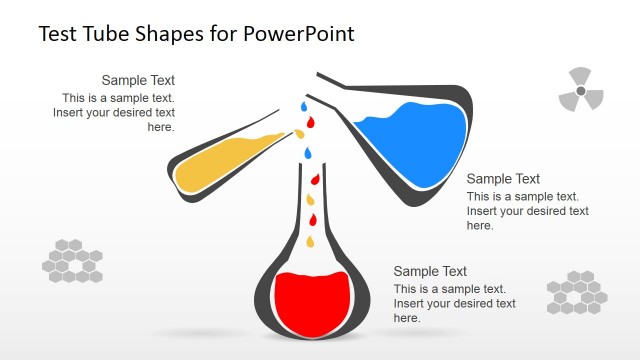
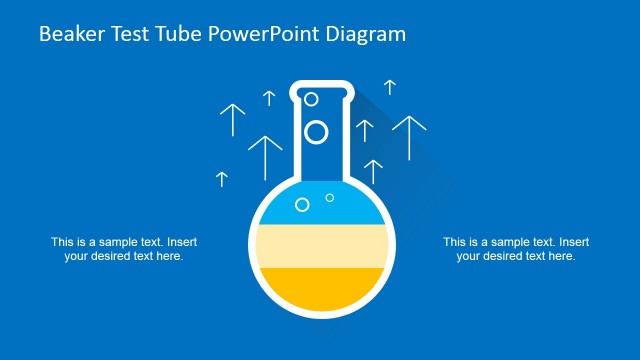
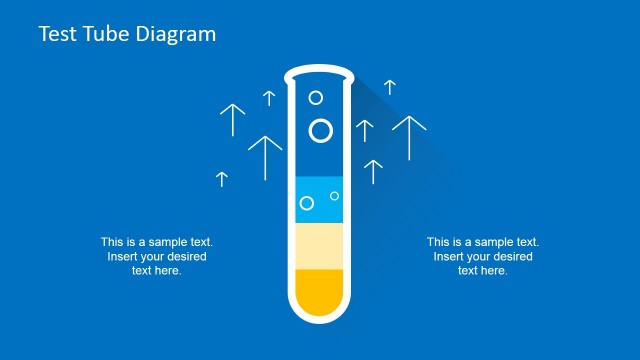
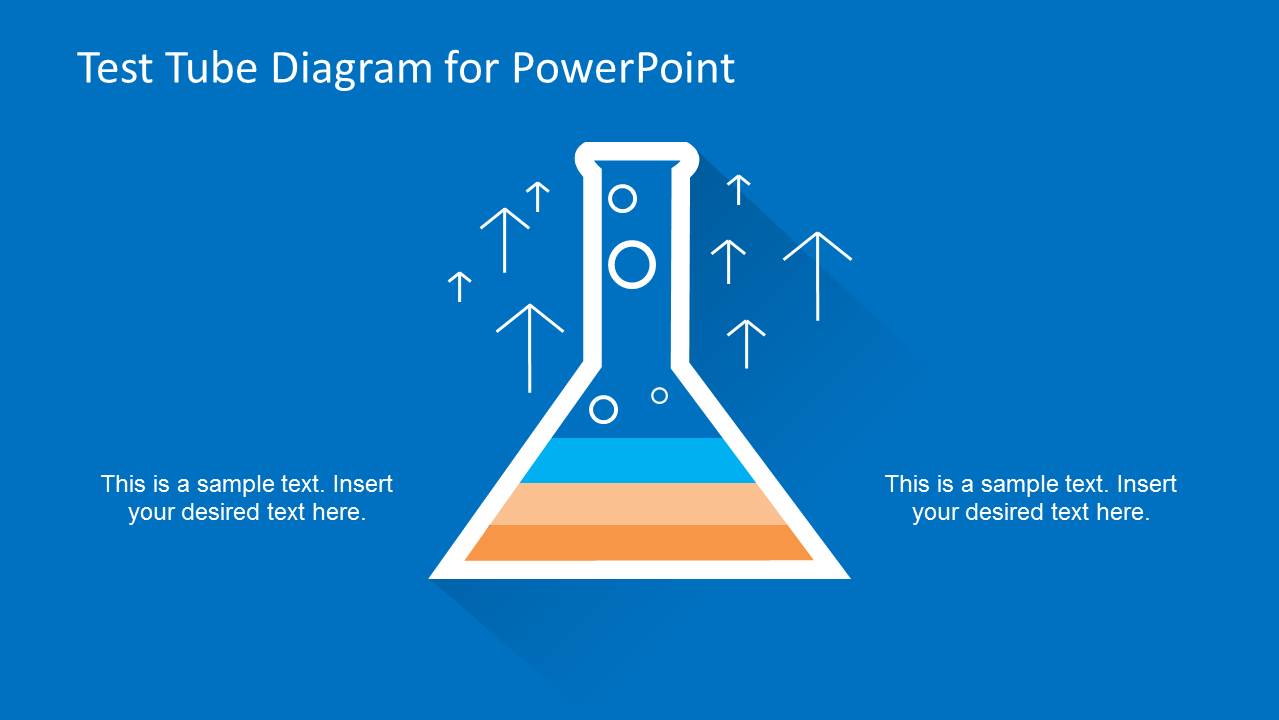
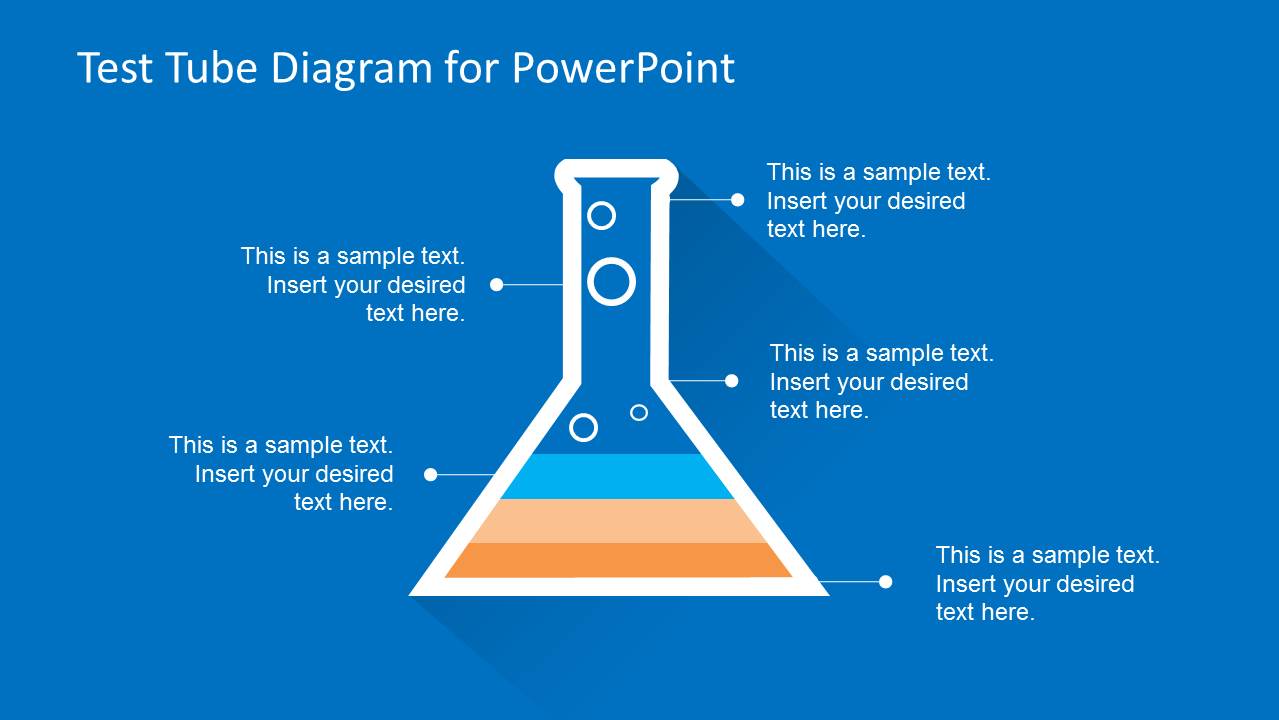
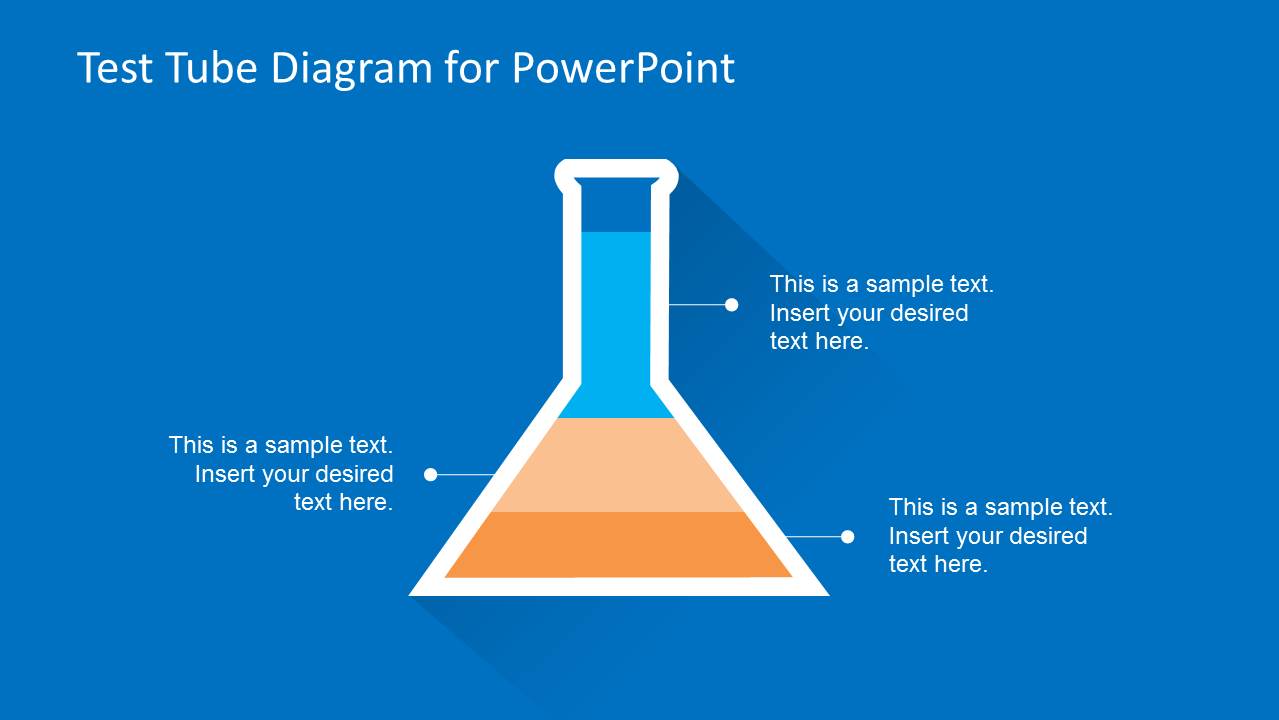
This ppt template has a test tube that students can find in school labs. The base of test tube has layers that can be used to show the ingredients; the bubbles rising up can depict the products of the reaction.
It can also be used as a business template for presentation, where the test tube boundary shows the limitations of an organization. The core values to be placed in the base and the feasible solutions of any problem being faced to rise up in bubbles. It can also be used as a sales funnel template with the costs being laid out at the base. The costs to be counted for include manufacturing, processing and sales costs as building blocks and additional data can be displayed to explain the cost.
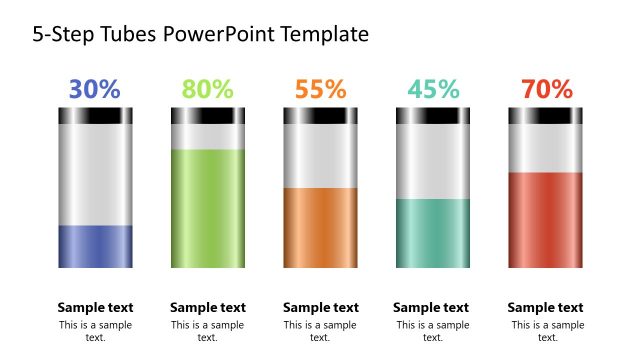
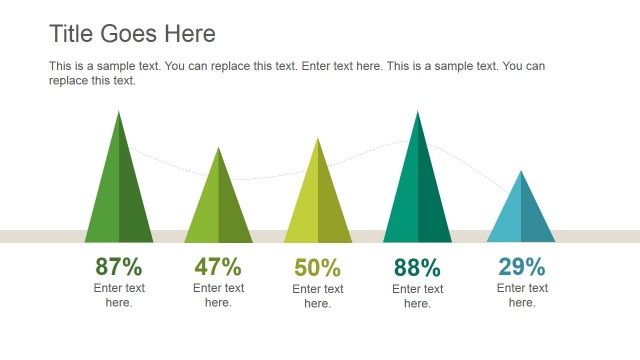
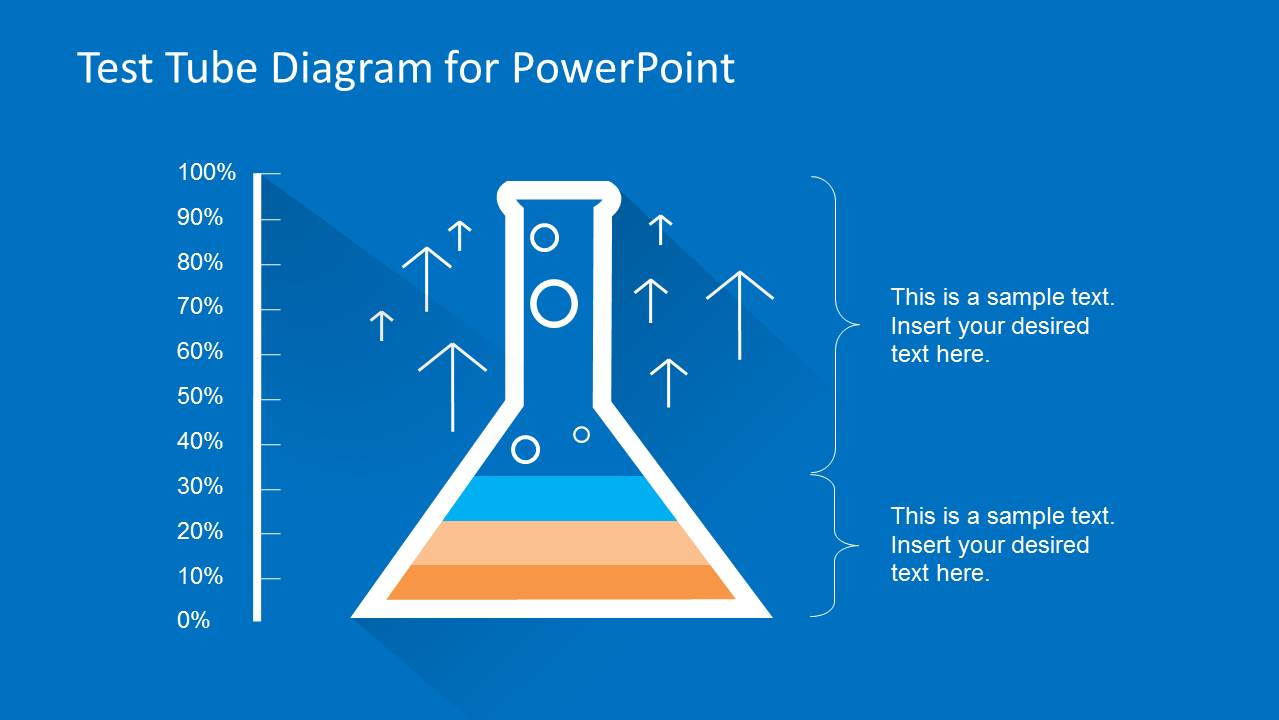
Different layouts of test tube are available in this template for presentation. It can be used to show different results at different times of a project life, with different results at different life percent shown. Also applicable to show the scientific reaction with arrows showing the direction of reactions. With ingredients at the base and bubbles coming out, the user can create a cause and effect diagram for PowerPoint.


You must be logged in to download this file.
DOWNLOAD- Category
- Diagrams
- Rating


 Loading...
- Size
- 16x9
- Item ID
- 6574
- Colors
Subscribe today and get immediate
access to download our PowerPoint templates.