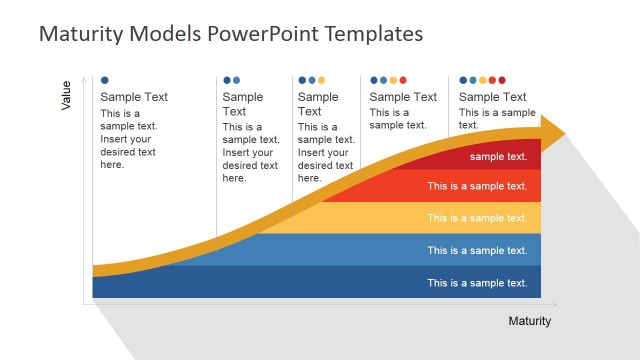
Curved Business Maturity Benchmark Graph PowerPoint Model
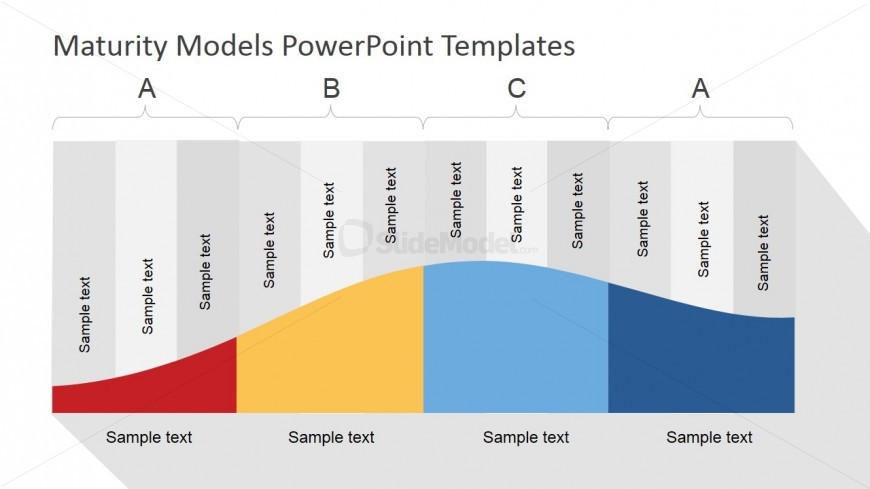
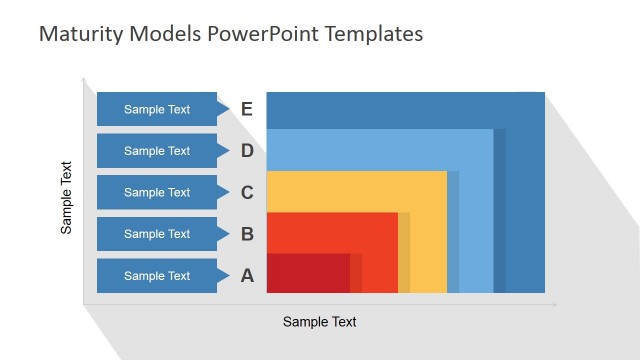
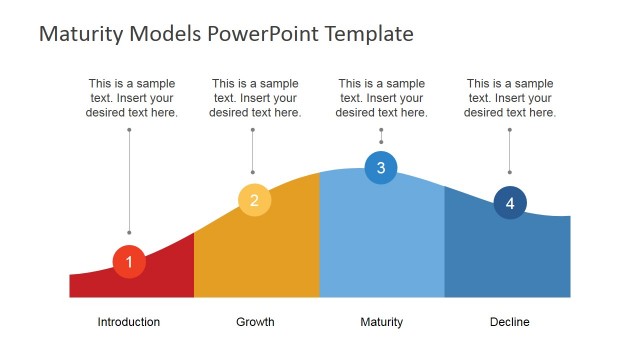
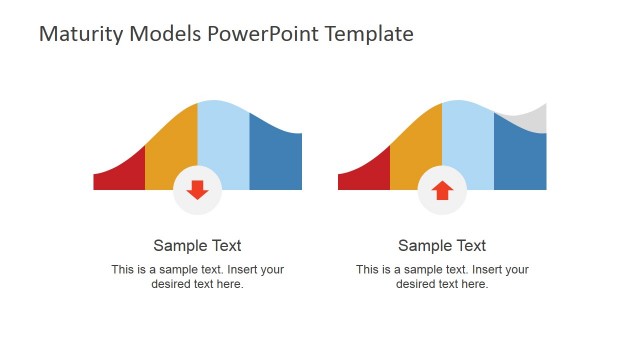
The Curved Business Maturity Benchmark Graph PowerPoint Model features a bell curve that is divided into four segments. These segments are colored red, yellow, light blue, and dark blue for easy distinction. These are labeled A, B, C, and D. Each segment is then divided into three more segments. The PowerPoint objects can be modified regarding their size, position, and color without affecting their graphic resolution.
Predetermined markers can be used to label specific points along the bell curve to indicate a state of maturity. It is important to distinguish the maturity of a business in order to avoid unnecessary risk due to misinformation.
Return to Flat Maturity Models PowerPoint Template.