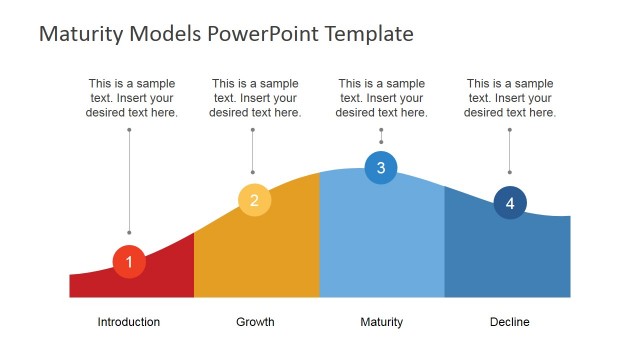
Curving Graph for Business Maturity PowerPoint Model

Complex Curving Maturity Progress Graph Model for PowerPoint

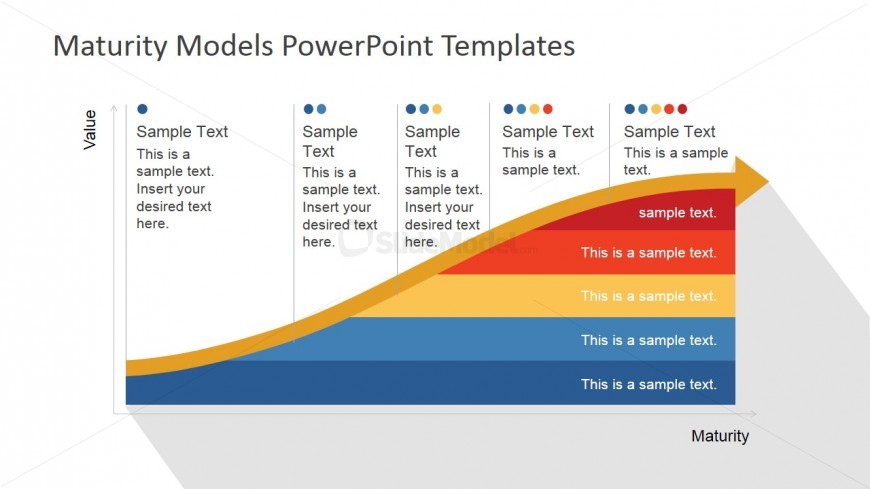
This slide features a composite diagram with a number of important elements. Sitting astride an x and y axis there is a curving graph which indicates the growth of a company against a number of predetermined benchmark aspects. Above this, segmented with differently spaced bars, there are a number of coloured circles which indicate these predetermined benchmark aspects. Within the segmented bars there are editable text boxes which can be used to explore the constituent elements of that benchmark.

Return to Flat Maturity Models PowerPoint Template.

Activate your subscription

Download unlimited PowerPoint templates, charts and graphics for your presentations with our annual plan.

DOWNLOAD

Slide Tags:

5 Stages 5 Steps Arrow Bar Chart Curve Flat Framework Longshadow Management Marketing Maturity Models Process Quality Sales Shadow Technology X Axis

Return to Flat Maturity Models PowerPoint Template.

Download Unlimited Content

Our annual unlimited plan let you download unlimited content from SlideModel. Save hours of manual work and use awesome slide designs in your next presentation.

Subscribe Now