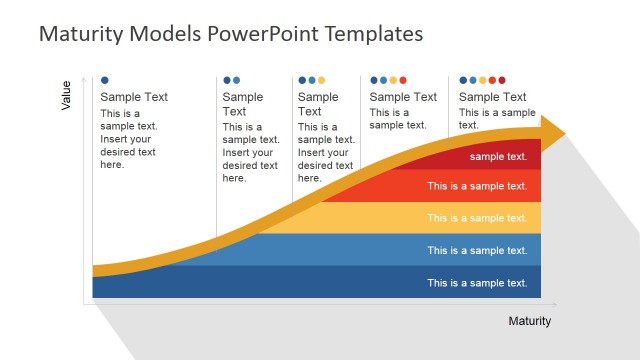
Complex Four Quadrant Graph for Business Maturity PowerPoint Model
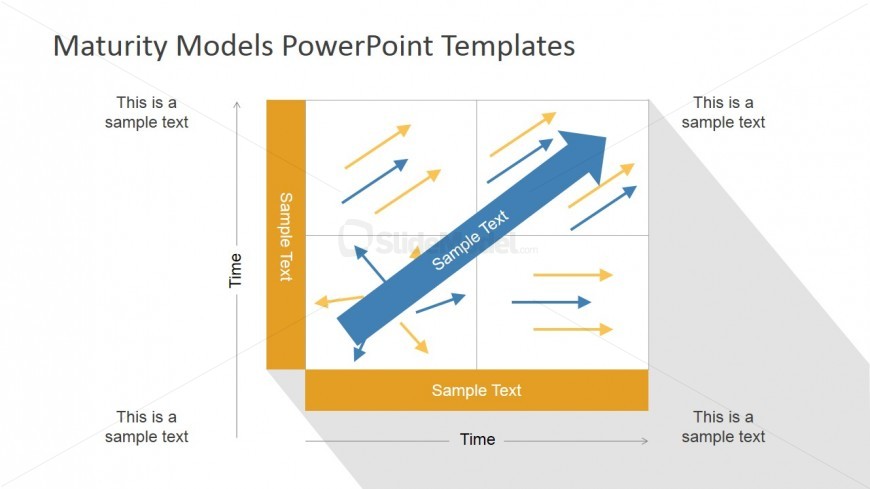
The slide design shows a Complex Four Quadrant Graph for Business Maturity PowerPoint Model. It can showcase a graphical representation of the company’s growth or maturity across several time periods. This type of information is important in determining and analyzing the flaws and defects of a particular business model.
Featured on the PowerPoint slide is a graph in four quadrants. It contains small arrows that determine the flow of certain types of data. A larger, main arrow is shown diagonally on the graph. The slide contains text placeholders which can contain labels for the quadrants. This design is created in high definition graphics and modification will not have any effect on the image resolution.
Return to Flat Maturity Models PowerPoint Template.