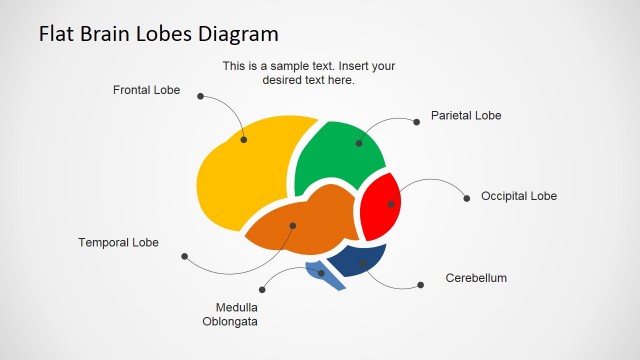
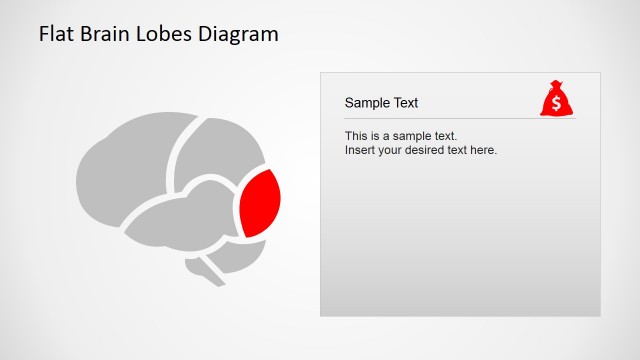
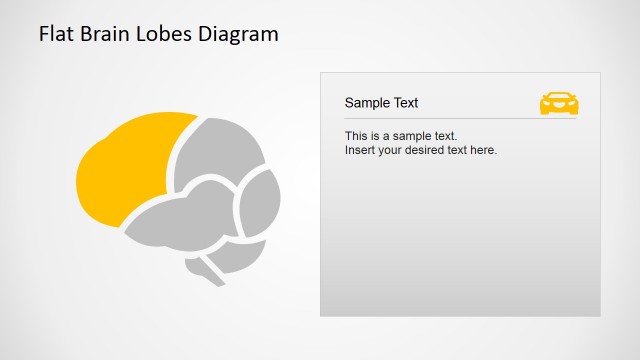
Brain Lobes Usage Cross Sectional Diagram with Icons
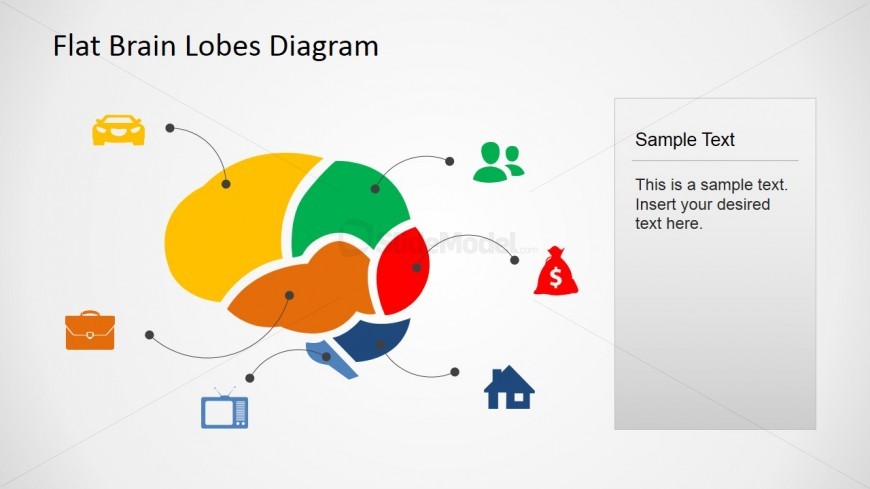
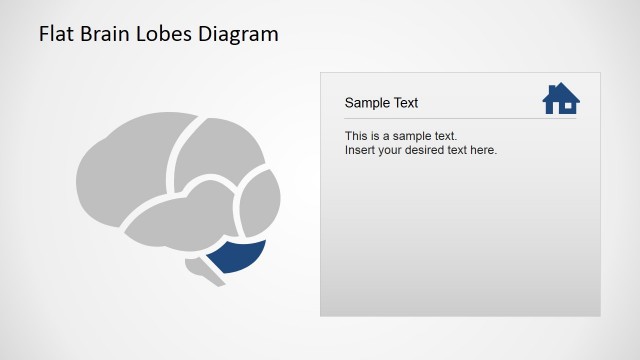
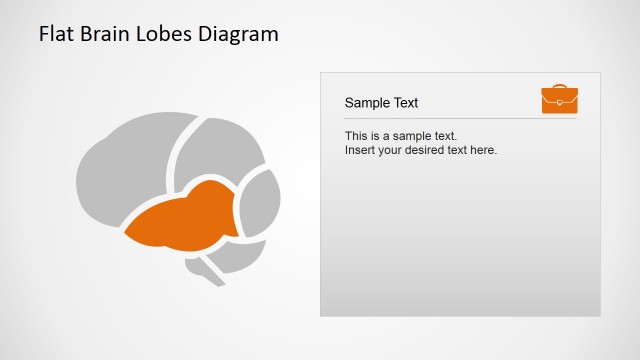
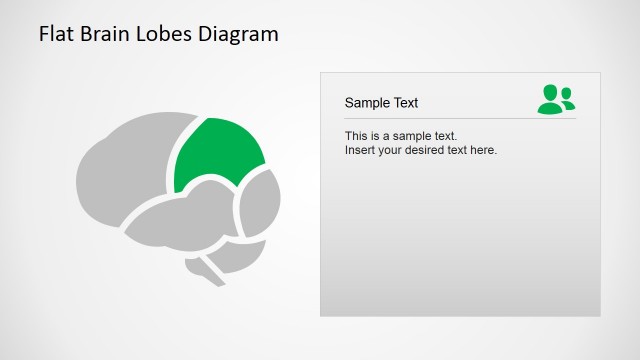
The human brain is composed of six individual lobes which work together to create the body’s central control system. Each of these six lobes has its own job to fulfil. This slide indicates this by using color coded icons to denote the particular use of that lobe. Here you can see that the frontal lobe (yellow) has been illustrated with a car to demonstrate its role in movement, reasoning and planning; the parietal lobe (green) which is illustrated with two people to denote its role in recognition and stimulation, etc. All of the images that make up this slide are fully editable allowing you to change the color, size or insert text in the box to the right hand side of the page.
Return to Flat Brain Lobes Diagram for PowerPoint.