Slide 5 of 5 from Editable 3D Graph Infographic for PowerPoint
4-Stages Diagrams Template with 3d Vectors
3D Graph Infographic for Presentations
- Diagram
- Other
- Process Slide
- 16:9
- 100% Editable
What’s on This Slide
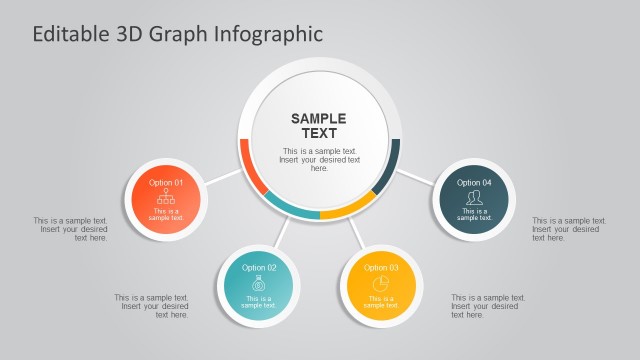
The layout features a central circular node labeled 'Sample Text,' surrounded by four smaller circular nodes labeled 'Option 01,' 'Option 02,' 'Option 03,' and 'Option 04.' Each node connects to the central node with straight lines. The central node is larger and visually emphasized compared to the surrounding nodes. Text placeholders are present in each node for titles and descriptions, aligned centrally. The background is a light gray gradient, enhancing the visual hierarchy and focus on the nodes.
How to Use It
This layout serves as a process diagram, illustrating relationships or steps in a workflow. It fits well in presentations discussing sequential processes or options available in a project. Suitable scenarios include project planning, decision-making processes, or outlining key features of a product. It can effectively summarize complex information into a clear visual format, making it easier for the audience to grasp the connections.
Text Placeholders & Capacity
Keep your copy within these limits so it fits without resizing. Node labels can hold about 3-4 words each, while body text is tighter at roughly 10 words each.
| Placeholder | Count | Max characters (approx.) |
|---|---|---|
| Item heading | 4 | 20 |
| Item body | 4 | 50 |
| Slide title | 1 | 30 |
| Body paragraph | 1 | 50 |
Slide Keywords
Download unlimited PowerPoint templates, charts and graphics for your presentations with our annual plan.
DOWNLOADReturn to Editable 3D Graph Infographic for PowerPoint.