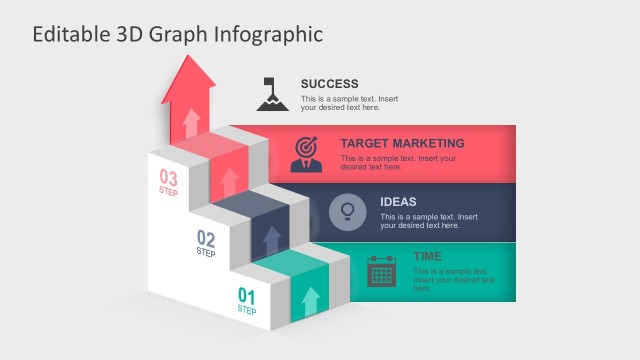
Slide 1 of 5 from Editable 3D Graph Infographic for PowerPoint
Editable 4 Step Process Diagram
3D Graph Infographic for Presentations
- Diagram
- Other
- Process Slide
- 16:9
- 100% Editable
What’s on This Slide
The layout features a central circular node labeled 'Sample Text' surrounded by four equally sized circular nodes labeled 'Option 01', 'Option 02', 'Option 03', and 'Option 04'. Each node contains a text placeholder for additional information. Connecting lines extend from the central node to each surrounding node, indicating a relationship. The background is a light gray, enhancing the visibility of the colored nodes, which include orange, teal, yellow, and dark blue. Text placeholders are centrally aligned within each node, maintaining a clear visual hierarchy.
How to Use It
This layout serves as a process diagram, illustrating a central concept with related options or steps branching out. It is suitable for presentations that require a visual representation of workflows, decision-making processes, or project phases. This structure can be effectively used in business meetings, project updates, or educational contexts to clarify complex ideas. It fits well at the beginning of a presentation to introduce key topics or at the end to summarize options.
Text Placeholders & Capacity
Keep your copy within these limits so it fits without resizing. Node labels can hold about 6 words each, while body text can accommodate around 10 words.
| Placeholder | Count | Max characters (approx.) |
|---|---|---|
| Item heading | 4 | 30 |
| Item body | 4 | 50 |
| Slide title | 1 | 30 |
| Body paragraph | 1 | 100 |
Slide Keywords
Download unlimited PowerPoint templates, charts and graphics for your presentations with our annual plan.
DOWNLOADReturn to Editable 3D Graph Infographic for PowerPoint.