Slide 4 of 4 from Downward Curves for PowerPoint
6072-04-concept-curves-downward-4
Downward Concept Curves for PowerPoint
- Diagram
- Other
- Strategic Analysis Slide
- 16:9
- 100% Editable
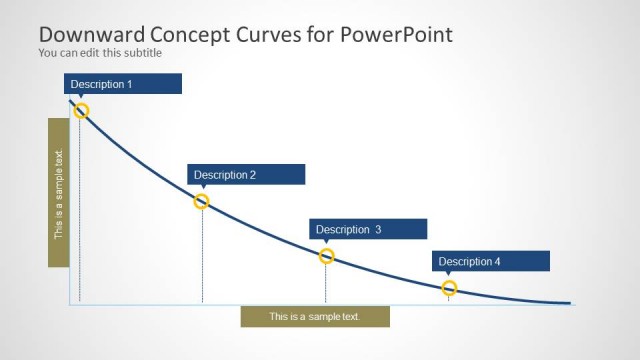
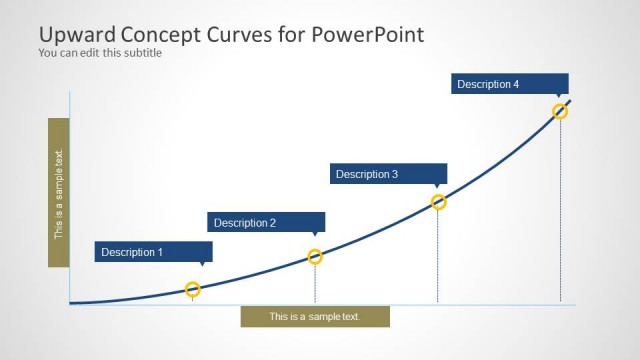
The Downward Concept Curves slide from the Downward Curves for PowerPoint template offers a clear visual for illustrating declining trends in financial reports and strategic assessments. This slide layout includes editable shapes and vector icons arranged along a downward curve, making it suitable for business presentations that require a precise depiction of negative performance metrics within a pitch deck template or corporate presentation.
What’s on This Slide
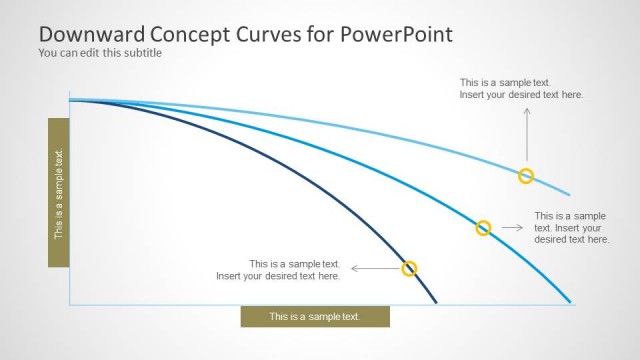
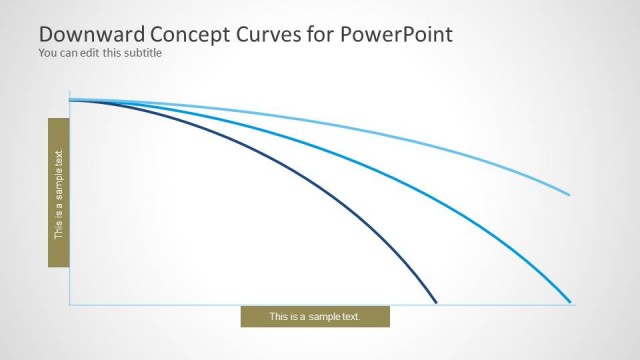
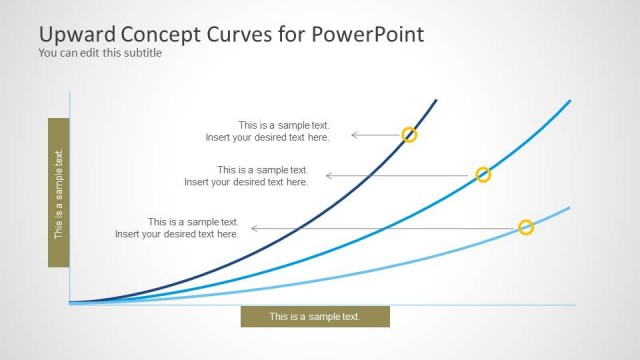
The slide features a downward curve diagram with four labeled sections at the top. Each section has a corresponding circular node along the curve, indicating a decline. Below the curve, there are two text placeholders aligned left and right, with one positioned in a gold rectangular container. The placeholders are for descriptions and are visually distinct from the curve. The background is light gray, providing contrast to the blue curve and yellow nodes. The overall layout emphasizes the downward trend through the arrangement of elements.
How to Use It
This layout serves to illustrate declining trends or negative performance metrics in a business context. It is suitable for presentations discussing issues like recession, failure, or decreasing metrics. Positioned as the final slide in a sequence, it can effectively summarize key points or provide a visual representation of a downward trajectory. This format is useful in scenarios where a clear depiction of decline is necessary, such as financial reports or strategic assessments.
Text Placeholders & Capacity
Keep your copy within these limits so it fits without resizing. Node labels can hold roughly 3-4 words each.
| Placeholder | Count | Max characters (approx.) |
|---|---|---|
| Slide title | 1 | 30 |
| Subtitle | 1 | 30 |
| Item heading | 4 | 20 |
| Item body | 4 | 30 |
Slide Keywords
Download unlimited PowerPoint templates, charts and graphics for your presentations with our annual plan.
DOWNLOADReturn to Downward Curves for PowerPoint.