Slide 28 of 32 from #2 Editable Data Driven Maps Bundle
Editable China Map in PowerPoint
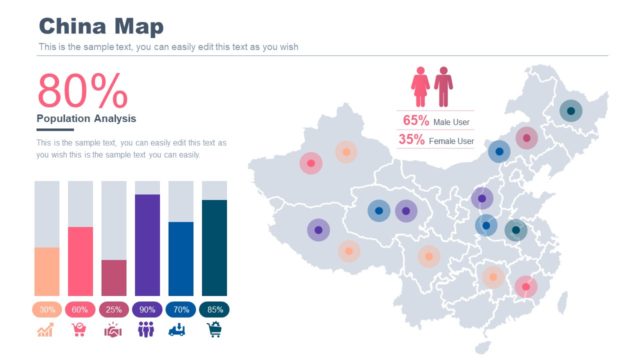
China Map with Population Analysis Slide
- Map
- Country Map
- Data Analysis Slide
- 16:9
- 100% Editable
The China Map with Population Analysis slide from the #2 Editable Data Driven Maps Bundle provides a clear geographic visualization ideal for demographic and market research presentations. This slide template combines editable shapes and vector icons to illustrate population statistics effectively, making it suitable for business presentations and strategic planning slide decks.
What’s on This Slide
The slide features a map of China positioned on the right side, with a light blue background. On the left, there are five vertical bar charts displaying population data, each with different colors. The largest bar is highlighted in a darker shade. Above the map, the title 'China Map' is prominently displayed in bold blue text. Below the title, a percentage figure of '80%' is shown, indicating population analysis. Additional text placeholders are present beneath the percentage, with a gender breakdown of users represented by icons of male and female figures. The overall layout is structured for clarity.
How to Use It
This layout serves as a geographic representation of demographic data, specifically for China. It fits within a presentation sequence that discusses population statistics or market analysis. This slide is useful for business analysts presenting market segmentation or demographic insights. It can be applied in contexts such as market research, strategic planning, or demographic reporting, where visual data representation enhances understanding.
Text Placeholders & Capacity
Keep your copy within these limits so it fits without resizing. Body slots can accommodate roughly 5-10 words each.
| Placeholder | Count | Max characters (approx.) |
|---|---|---|
| Slide title | 1 | 20 |
| Body paragraph | 3 | 50 |
| Item heading | 5 | 10 |
| Item body | 5 | 5 |
| Callout | 1 | 30 |
Slide Keywords
Download unlimited PowerPoint templates, charts and graphics for your presentations with our annual plan.
DOWNLOADReturn to #2 Editable Data Driven Maps Bundle.