Cycle Arrows Venn Diagram PowerPoint Template
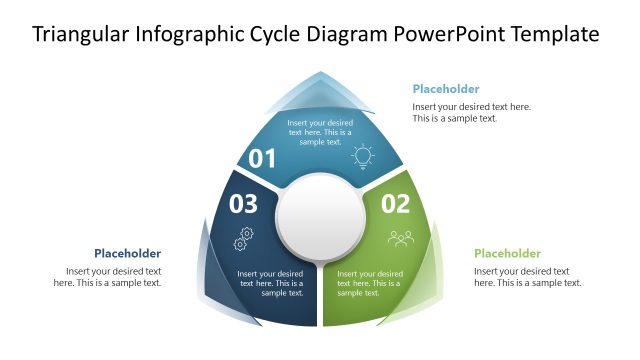
Map continuous improvement cycles with precision using our customizable Cycle Arrows Venn Diagram PowerPoint Template. Designed for business consultants and strategy leads, this three-stage cyclic arrow layout provides a compelling alternative to standard process diagrams, capturing not just sequence but the interdependence and overlap between phases. Whether you are presenting a workflow optimization system, a project lifecycle overview, or a supply chain process, this PowerPoint template translates cyclical logic into a visual structure your audience can read at a glance. We have designed this PPT slide to help presenters communicate recurring processes, continuous improvement frameworks, and stage-by-stage workflows with clarity and visual authority.
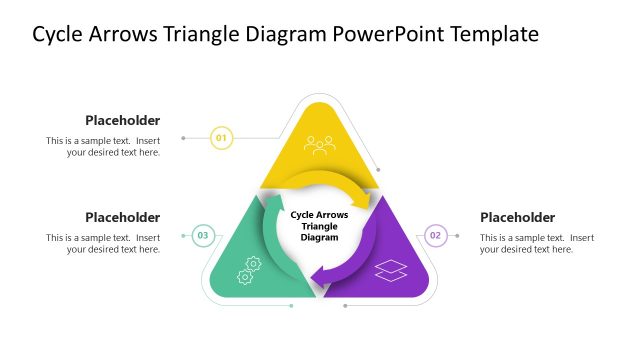
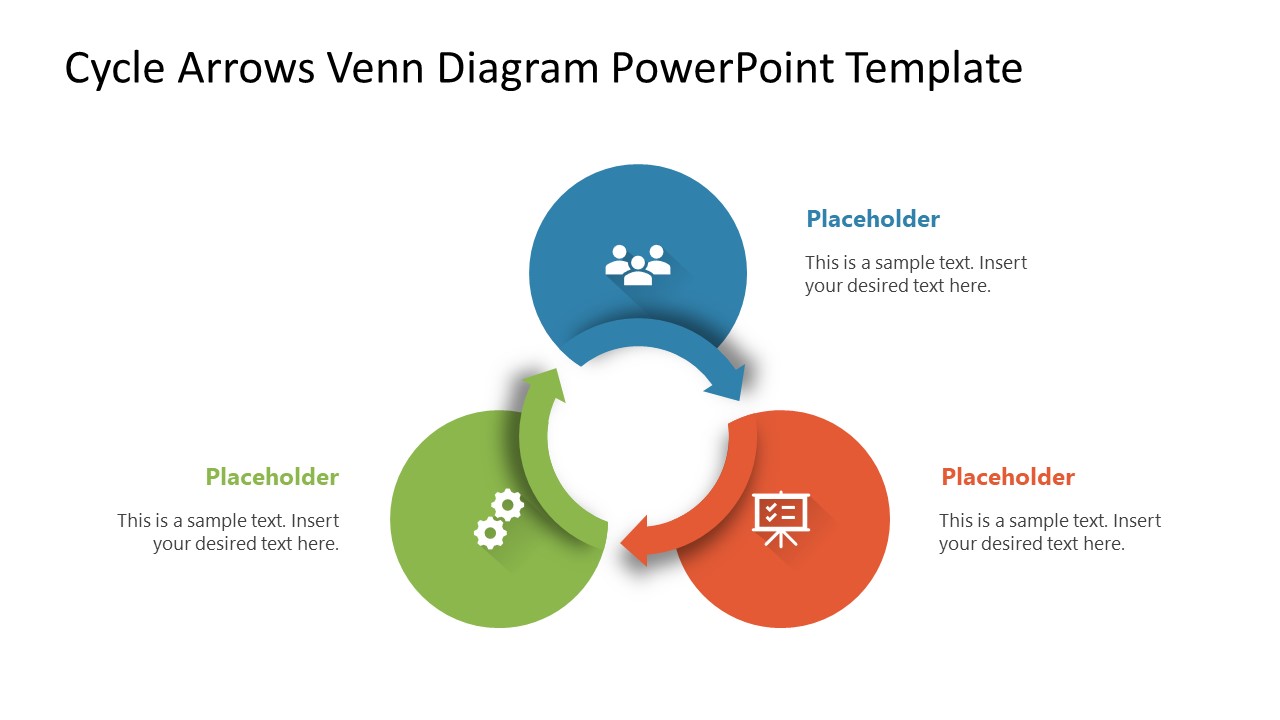
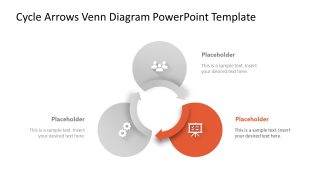
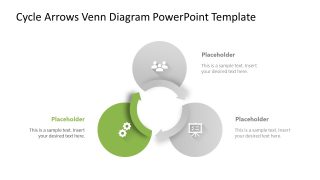
Three curved arrows form a closed loop, each representing a distinct stage in a continuous process, with color-coded segments that visually reinforce the relationship between phases. It acts as a Color-Coordinated Stage System: The arrow, its connected shape, and the placeholder text block share a unified color per stage, making it easy for audiences to track each component without additional explanation. Follow-up slides can isolate each stage with a color emphasis effect, allowing you to walk through the cycle step by step and keep your audience focused on one phase at a time.
QA engineers can use our Cycle Arrows Venn Diagram PowerPoint Template to explain improvement cycles; HR directors to outline talent onboarding and filtering stages; and marketing managers to visualize campaign optimization processes during monthly reviews.
Download this customizable cycle arrows Venn diagram template and present your continuous business processes with a layout built for clarity and repeated use. Perfect for any three-stage workflow where the relationship between phases is as important as the phases themselves.


You must be logged in to download this file.
DOWNLOAD- Category
- Diagrams
- Rating

 Loading...
- Size
- 16x9
- Item ID
- 23610-01
- Colors
Subscribe today and get immediate
access to download our PowerPoint templates.