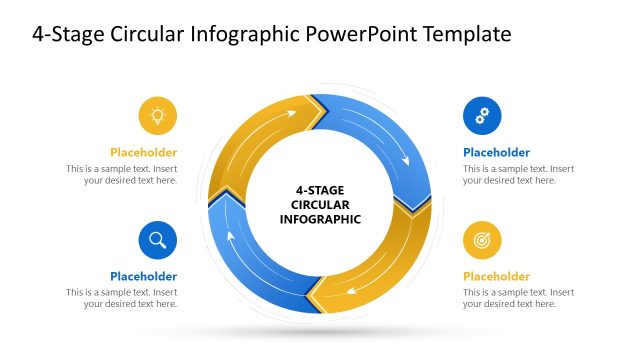
4-Stage Circular Infographic PowerPoint Template
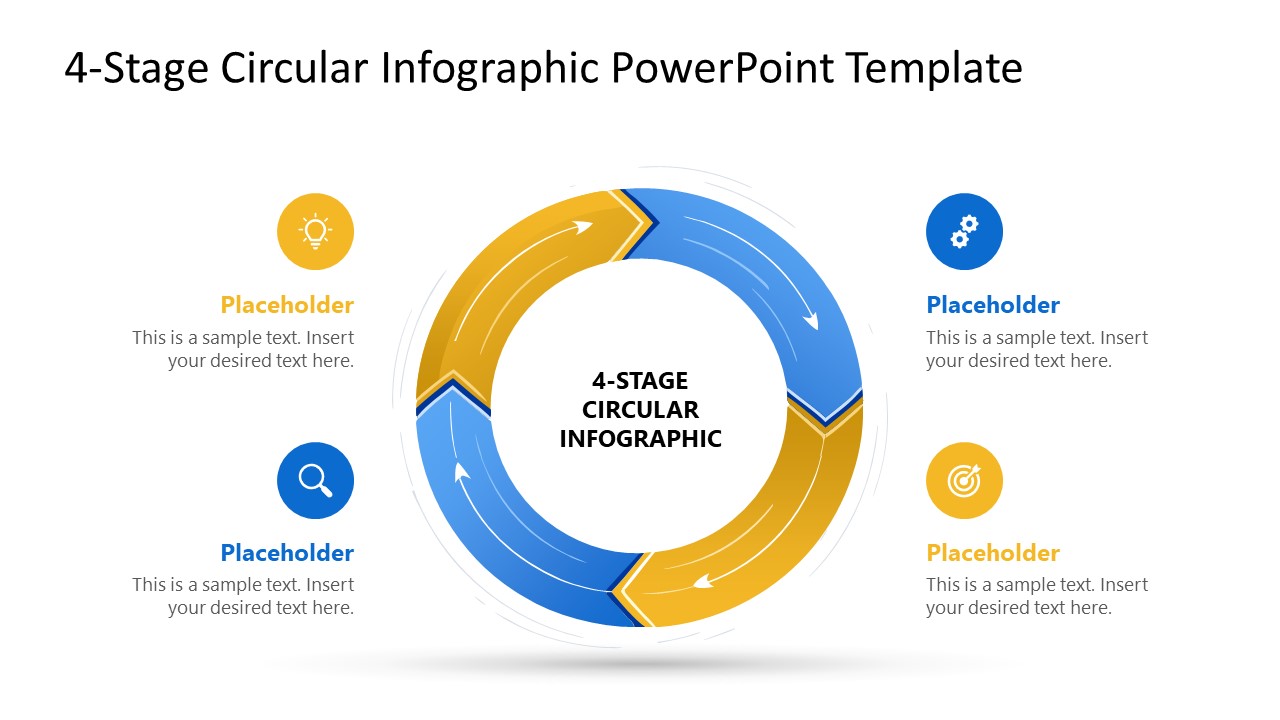
Present the continuous improvement models in your employee training presentation with our 4-Stage Circular Infographic PowerPoint Template. In supply chain management presentations, logistics experts use this circular diagram to illustrate the vendor evaluation cycle to executive-level audiences. The four-segment visual cycle enables QC leads to map four interdependent stages in a continuous process. They can illustrate the product improvement loop, showing how quality standards are maintained for clients. Project managers use the four-step cycle diagram to comprehensively present the product lifecycle stages in team presentations. Management consultants can use the 4-stage circular infographic to illustrate the recurring improvement loop (PDCA) that increases process efficiency. Operations managers use the cyclic diagram template for their stakeholder presentations and discuss the steps of a complex iterative workflow in a simplified layout. We allow professionals to repurpose the template for showing data pipelines or marketing processes.
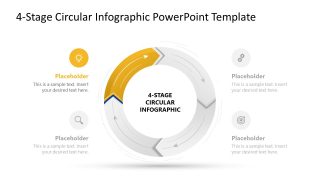
The 4-Stage Circular Infographic PowerPoint Template is compatible with all PowerPoint versions, and users can adjust the design to fit their theme. It uses a circular arrow diagram divided into four segments, alternating between blue and gold. The connecting arrows depict the continuity and direction. Each stage has its corresponding text section paired with a graphical icon to aid in visual demonstration. The color separation creates contrast between process steps, making it quite visible to the audience and helping them grasp distinct stages.
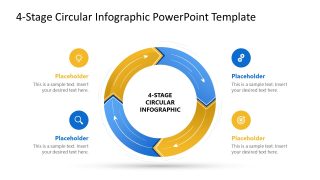
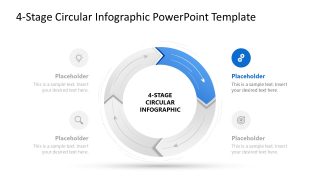
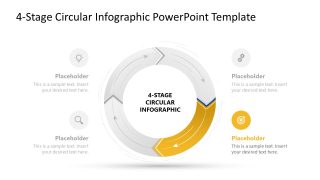
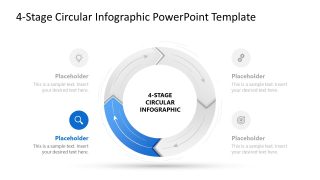
Furthermore, operational directors can focus on each stage separately using spotlight slides, where only one component of the diagram is highlighted in color, while the others are grey. This enables the audience to understand the concept effectively with focus. Download the 4-stage circular infographic template to clearly outline development cycles for your stakeholders.


You must be logged in to download this file.
DOWNLOAD- Category
- Diagrams
- Rating

 Loading...
- Size
- 16x9
- Item ID
- 23652-02
- Colors
Subscribe today and get immediate
access to download our PowerPoint templates.