Showcase customer data in a graphical format with our Customer Portfolio Management PowerPoint Diagrams template. CPM, or customer portfolio management, is the process of collecting and storing customer’s data to enhance the business performance. The data may include the customer’s name, age, geographical location, interests, behavior, and financial position. This data can differ from business to business and can be employed in business intelligence to identify an accurate customer base and improve decision-making. When companies know everything about their customers, they can craft better strategies to increase sales and convert more leads. We have designed this unique strategic customer management visualization toolkit with data charts and tables to present the customer’s data in an attractive format. Users can edit the CPM tool’s data labels, icons, and aspects according to their customer base. Professionals can demonstrate their relative data points to the stakeholders for successful action plans.
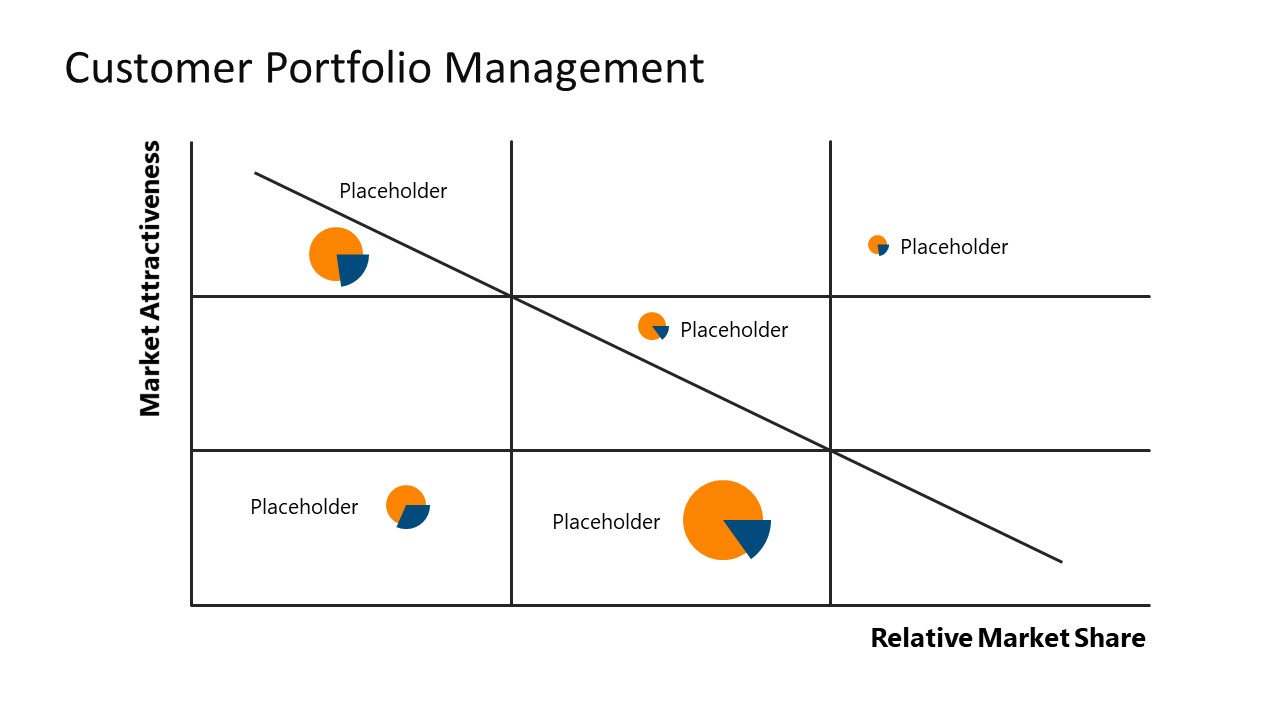
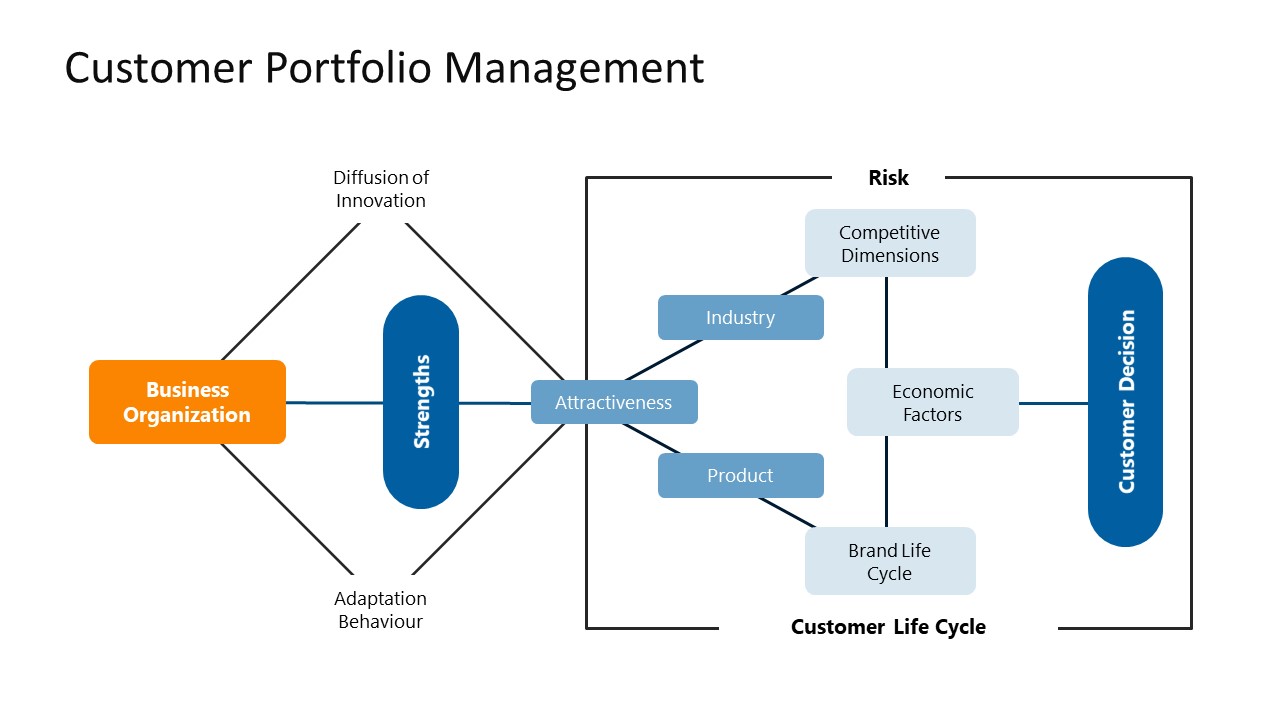
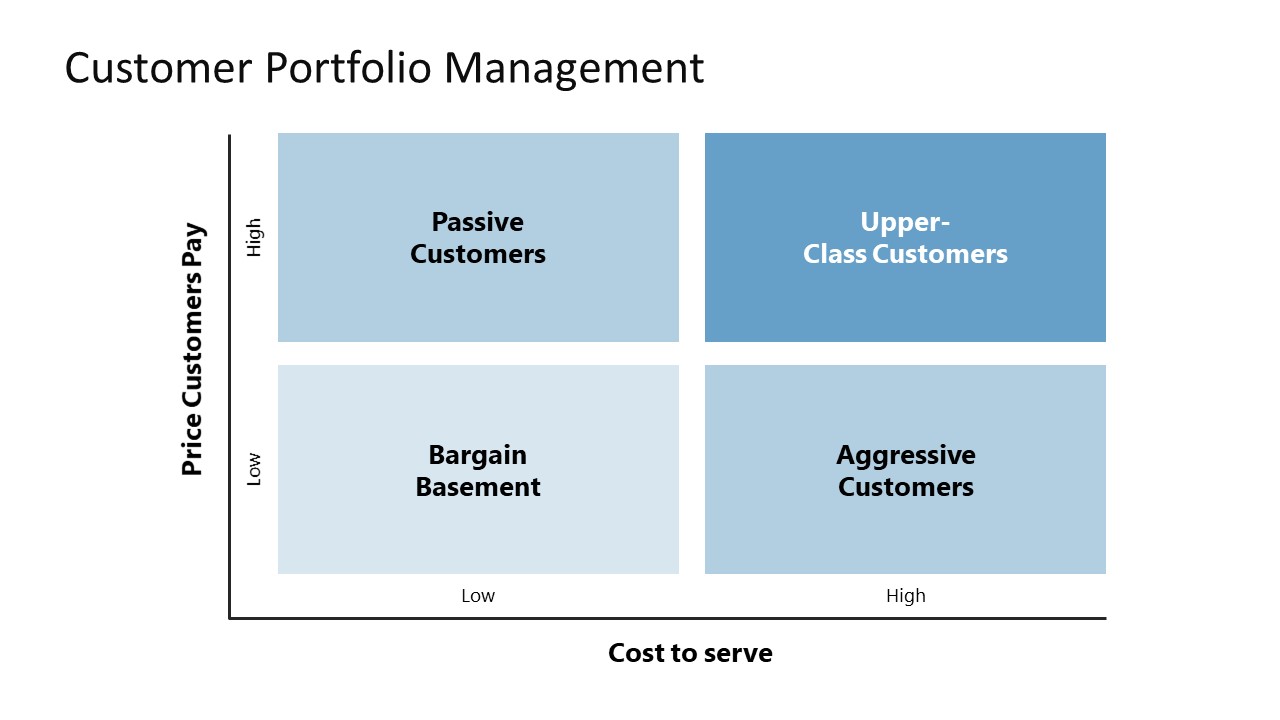
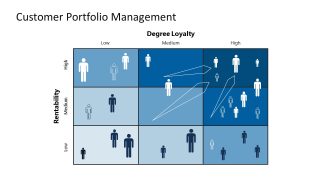
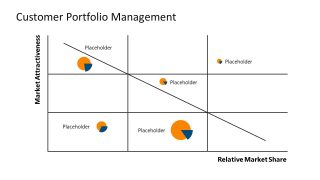
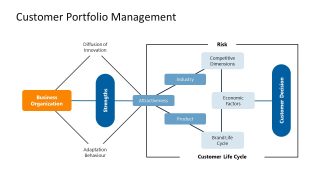
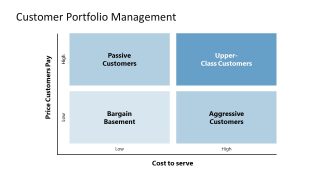
The Customer Portfolio Management PowerPoint Diagrams contain six customizable client portfolio mapping slides. The first slide has a 3×3 table chart with a degree of loyalty and rentability on two axes of the table. The number of human infographics and colors differs in different cells based on the customer’s data. Next, a table presents the relational data between relative share and market attractiveness. Further, in the third slide, we have provided a flowchart diagram with different shapes to display the connection of various attributes in the business organization and customer life cycle. Also, in the following slide, there is a four quadrants matrix with the cost to serve on the x-axis and the price customers pay on the y-axis.
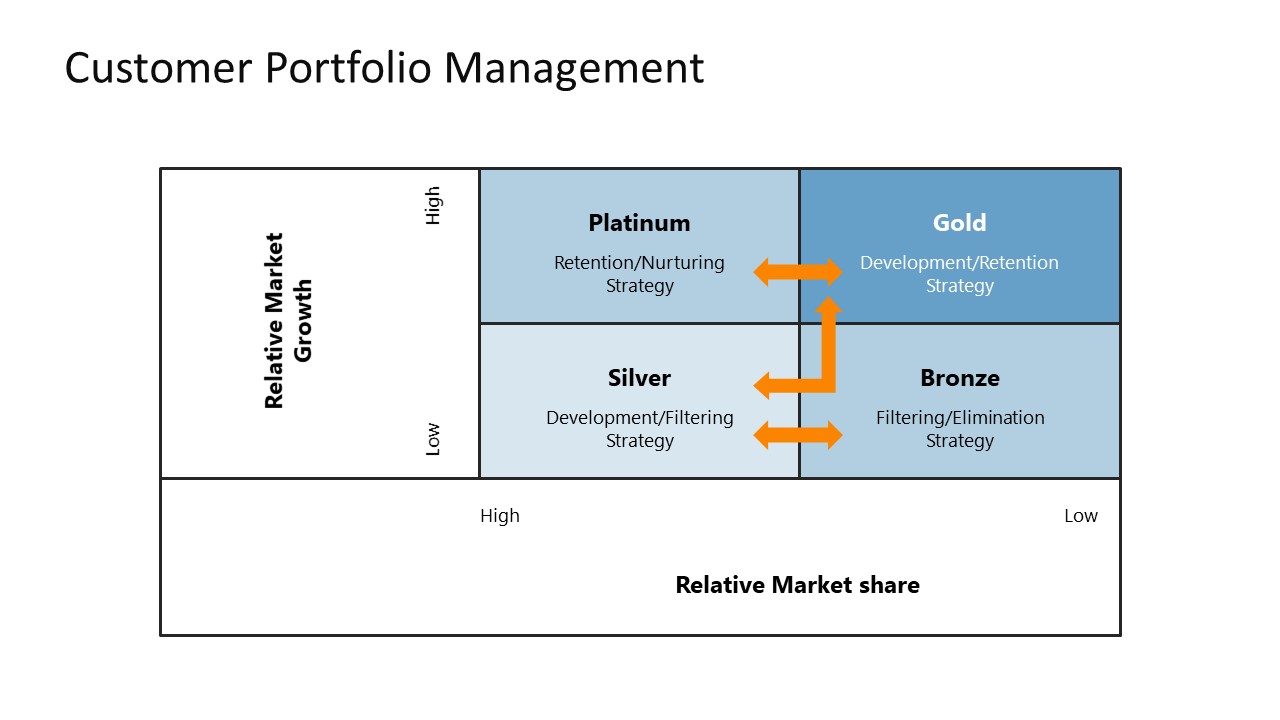
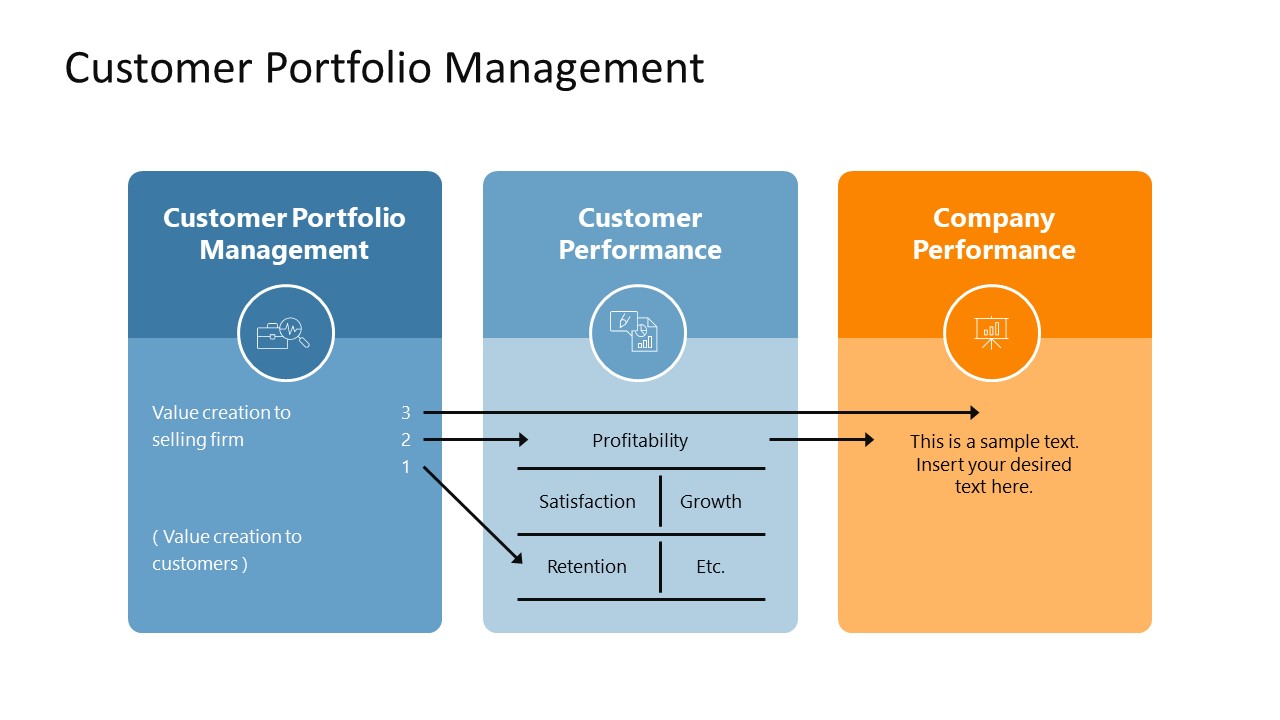
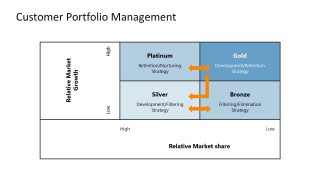
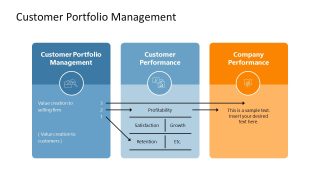
Presenters can also demonstrate the data between relative market growth and relative market share in the following diagram. In the last slide, there are three columns with arrows and headings to present the information related to:
- Customer Portfolio Management
- Customer Performance
- Company Performance
Moreover, users can change the fonts, colors, and other PPT elements of the customer portfolio management PowerPoint template to perfectly suit their needs. If you want to showcase your data in a visually appealing layout, download our comprehensive client portfolio diagrams pack and edit it now! Also, check our collection of portfolio presentation templates and diagram templates.
What’s inside this template
Example presentation scenarios
- A customer success leader can use the 3x3 loyalty/rentability matrix to show executives which customer groups deserve retention, nurturing, or service redesign attention.
- A strategy consultant can use the market attractiveness and relative market share chart to compare account opportunities and frame investment priorities for a client workshop.
- A sales operations manager can use the cost-to-serve quadrant to explain why high-cost, low-price accounts need pricing, packaging, or service-level changes.
- A business analyst can use the three-column performance framework to connect customer portfolio actions with customer satisfaction, retention, growth, and company profitability.
Features
- 100% editable presentation template
- Compatible with Microsoft PowerPoint and Google Slides
- 16:9 aspect ratio slides
- Scalable vector shapes, icons and illustrations
- AI-Ready for Microsoft Copilot and Claude
- Instant access and download
Frequently asked questions
Q: How should a presenter use these matrices to make a clear customer portfolio recommendation?
A: Start with the 3x3 loyalty/rentability matrix to establish how customers are distributed across value and commitment. Move to the attractiveness and market share chart to explain where growth potential exists. Finish with the performance framework so the audience sees the management action, customer outcome, and company outcome in one connected chain.
Q: Who is this template best suited for during customer strategy discussions?
A: This template fits teams that manage account portfolios rather than single customer journeys. Customer success leaders, sales strategy teams, and consultants can use the quadrant and 2x2 matrices to sort customers into clear groups, then discuss service level, retention effort, development strategy, or filtering decisions with stakeholders.
Q: Why do matrix and portfolio map layouts work well for customer management topics?
A: Customer portfolio decisions often require trade-offs between value, loyalty, market potential, and service cost. The matrix layouts make those trade-offs visible by placing each segment in relation to two decision criteria. The icons, arrows, and quadrants act as visual metaphors for prioritization, movement, and management focus.

Customer Portfolio Management PowerPoint Diagrams
6-slide presentation template for customer segmentation matrices, portfolio mapping, and performance analysis
Customer Portfolio Management PowerPoint Diagrams is a 6-slide presentation template for mapping customer segments and portfolio performance. It includes a 3x3 loyalty/rentability matrix, market attractiveness/share chart, customer lifecycle flowchart, cost-to-serve quadrants, and a three-column performance framework for strategy, sales, and customer success teams in Microsoft PowerPoint and Google Slides.
- Category
- Data & Charts
- Rating

 Loading...
- Aspect ratio
- 16:9
- Item ID
- 22371-01
- Colors
 Microsoft PowerPoint
 Microsoft Copilot
 Claude for PowerPoint
Other formats supported
Subscribe today and get immediate
access to download our PowerPoint templates.