Portfolio Management PowerPoint Templates
Investment committees and project portfolio reviews share a common problem: too many holdings or initiatives to walk through verbally without losing the audience. A Portfolio Management PowerPoint template solves that by laying out allocation, performance, and risk across a small number of slides built specifically for that comparison. Our portfolio management templates are built for financial advisors and PMO leads who report on a mix of assets or initiatives rather than a single item. The same structure works whether the portfolio holds ten securities or a dozen concurrent initiatives.


Asset Management PowerPoint Template
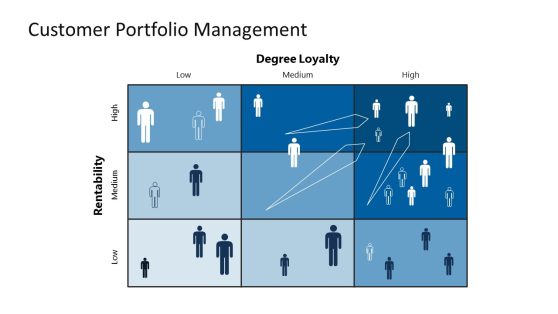
Customer Portfolio Management PowerPoint Diagrams

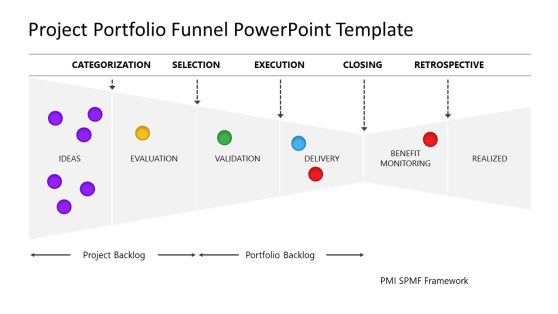
Project Portfolio Presentation Template
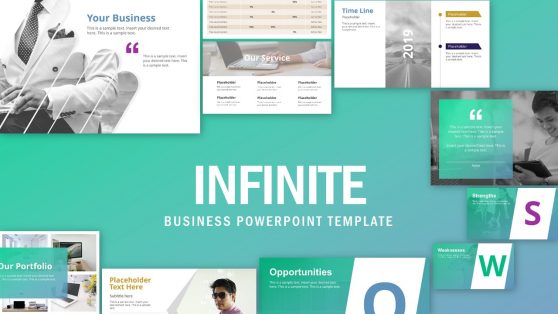
Infinite PowerPoint Template
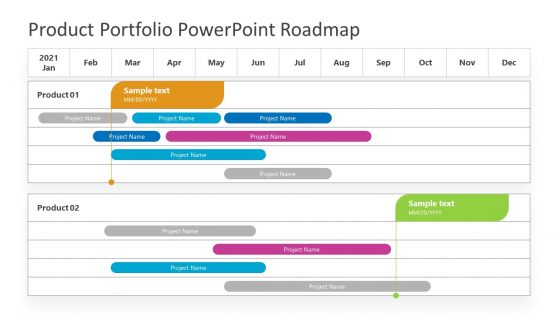
Product Portfolio Timeline Template


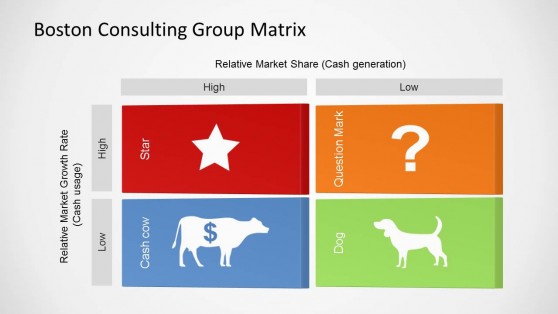
Boston Consulting Group Matrix Template for PowerPoint
Why Financial Advisors and PMO Leads Rely on Portfolio Slides
Reviewing a portfolio verbally forces the audience to hold several numbers in their head at once: allocation percentages, returns, and risk ratings, without a reference point. A portfolio management PPT template puts all three side by side, so a client or steering committee can compare holdings directly rather than reconstruct the comparison from a spoken summary. The format also standardizes how each holding or initiative gets reported, which matters when the same client or committee reviews the portfolio every quarter and expects a consistent layout. Advisors managing an investment portfolio presentation for a mixed client base find that a repeatable slide structure builds more trust over time than a redesigned deck each cycle.
What a Portfolio Management PowerPoint Template Covers
A portfolio management PPT template is a slide set structured around the recurring elements of an investment or project portfolio review: allocation, performance, and risk. A full set generally includes:
- Asset allocation charts by class, sector, or geography
- Performance tracking slides comparing returns against a benchmark
- Risk rating layouts for individual holdings or initiatives
- Project portfolio dashboards showing initiative status side by side
Who Uses Portfolio Management Templates
Financial advisors use the allocation and performance slides during quarterly client reviews, while PMO leads adapt the same layout logic for a project portfolio presentation that ranks initiatives by risk and expected return. Wealth managers building an investment portfolio presentation for a family office rely on the risk rating layout to justify a rebalancing decision, and corporate strategy teams use the dashboard format when a business portfolio spans multiple business units rather than financial assets.
Distributed advisory teams also present from Google Slides when a client review happens over video call, keeping the same file synced across every participant’s screen. Compliance teams reviewing portfolio disclosures also reference the same slides to confirm that reported allocations match the underlying holdings before a filing goes out.
What is a portfolio management presentation template?
It’s a slide deck built to present asset allocation, performance, and risk across a portfolio of investments or initiatives, replacing a verbal walkthrough with a layout the audience can compare at a glance.
How do I create a portfolio management PowerPoint template?
Start from a layout with allocation and performance sections already structured, then connect it to your portfolio data and update the risk ratings each reporting period.
Where can I find a free portfolio management presentation template?
Our library includes free and premium portfolio management layouts, from single allocation charts to full decks covering performance, risk, and project portfolio tracking.
Can a portfolio management PowerPoint template handle both financial and project portfolios?
Yes. The same allocation-performance-risk structure applies to either use case. Financial teams plug in securities and returns, while PMO teams substitute initiatives and delivery status without changing the layout.
Can the asset allocation chart show a target allocation alongside the current actual allocation?
Yes, a target ring or bar can be layered next to the actual allocation, showing drift from the intended portfolio mix at a glance.
Do the risk rating layouts support showing risk trend over time, not just a current rating?
Yes, a trend indicator or historical rating series can be added alongside the current risk rating to show whether a holding’s risk profile is improving or worsening.
Can the project portfolio dashboard group initiatives by strategic theme, not just by status?
Yes, initiatives can be grouped or color-coded by strategic theme, allowing the dashboard to show both status and thematic alignment in a single view.