Control Tower Diagram for PowerPoint
The Control Tower Diagram for PowerPoint is an illustrative presentation of supply chain management concept. The control tower, similar to flight and traffic control towers, it describes tracking of deliveries. This concept help make delivery process more efficient. Here, the control tower shape creates a hub for visibility, decision-making, and actions. These graphics will enable presenter to highlight ideas about improving networks and related activities. In this way, businesses can give a clear picture of process diagram and allocation of resources between various segments of supply and chain flow. Similarly, the viewers can identify problematic activities or suggest improvements for more effective supply chain model.
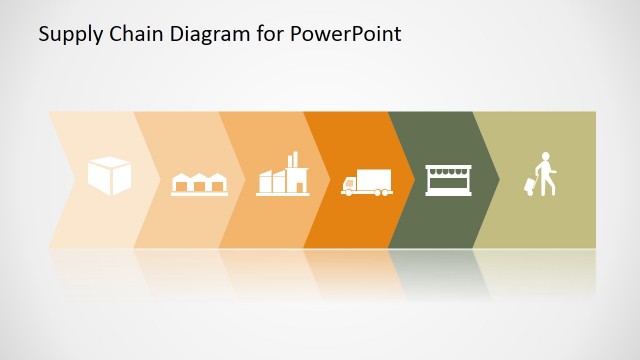
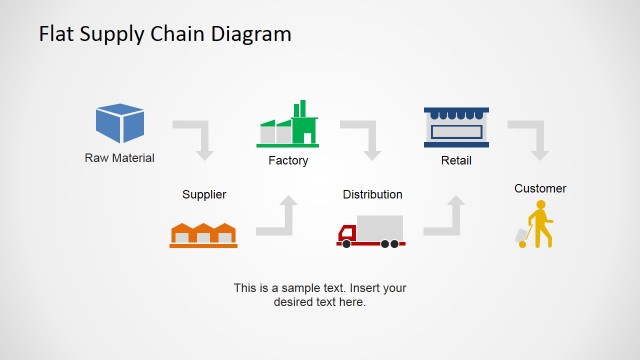
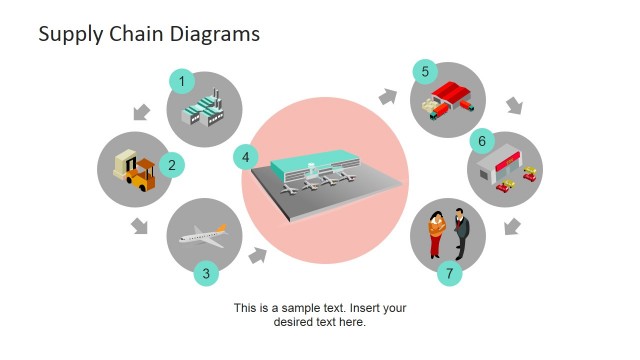
The illustrative PowerPoint shapes in control tower diagram are high-quality vector graphics. There are two slides of showing processes downwards and sideways. For example, the first slide shows control tower shadowing down on 6 individual elements of supply chain. Whereas, the second slide shows these segments around control tower for real-time tracking. Further, the 6 segments of supply chain include Raw material, Suppliers, Manufacturer, Distributor, Retailer, and Consumer. And, the control tower PowerPoint contain modern clipart icons as metaphors to visually represent these processes.
The Control Tower Diagram for PowerPoint is a fully customizable set of slide designs. The users can take advantage of graphics and copy slides into management presentations for strategy and planning. The users can add or delete PowerPoint objects in template to complement their supply chain management presentation.


